Open Access
Fig. 7.
Download original image
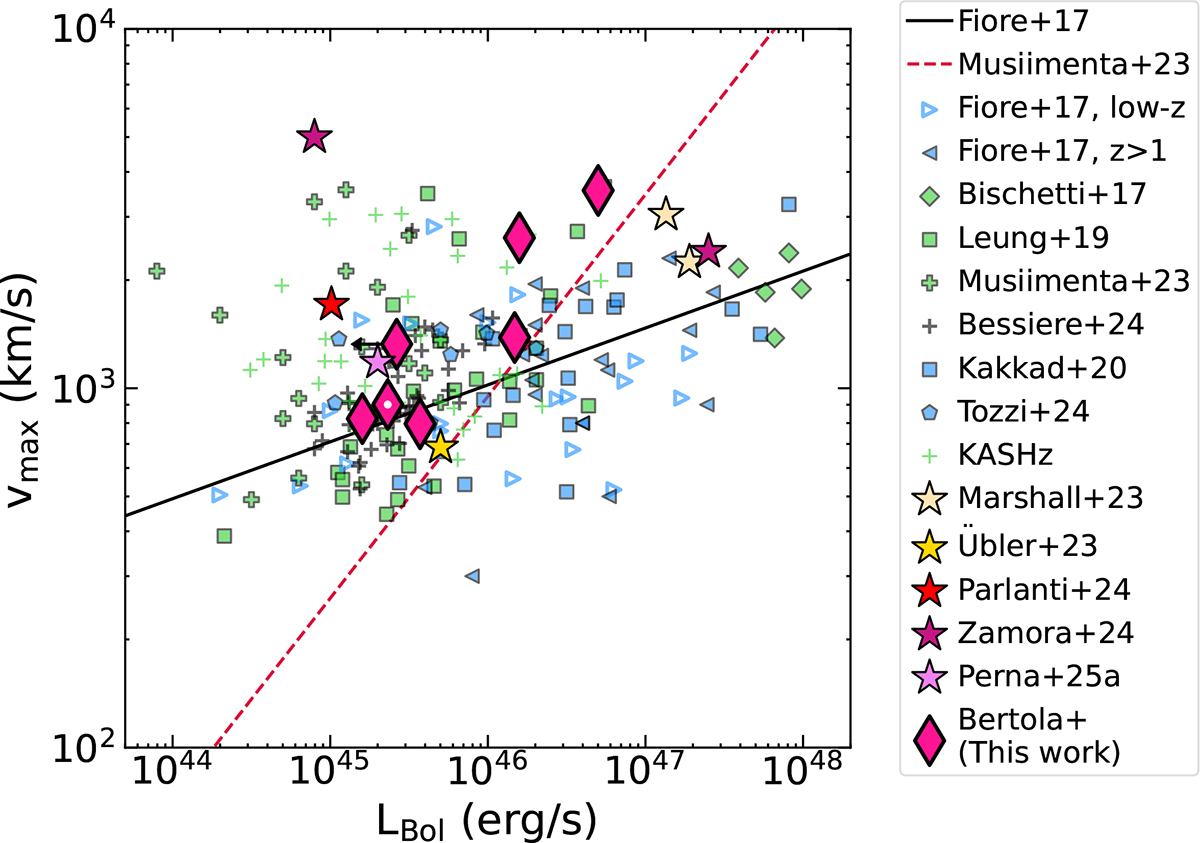
Outflow velocity vmax as a function of bolometric luminosity of GA-NIFSCOS-AGNi and literature samples used in this work. The color coding is the same as Fig. 1. The solid line marks the best fit relation of Fiore et al. (2017) and the dash-dotted line the best fit relation of Musiimenta et al. (2023).
Current usage metrics show cumulative count of Article Views (full-text article views including HTML views, PDF and ePub downloads, according to the available data) and Abstracts Views on Vision4Press platform.
Data correspond to usage on the plateform after 2015. The current usage metrics is available 48-96 hours after online publication and is updated daily on week days.
Initial download of the metrics may take a while.