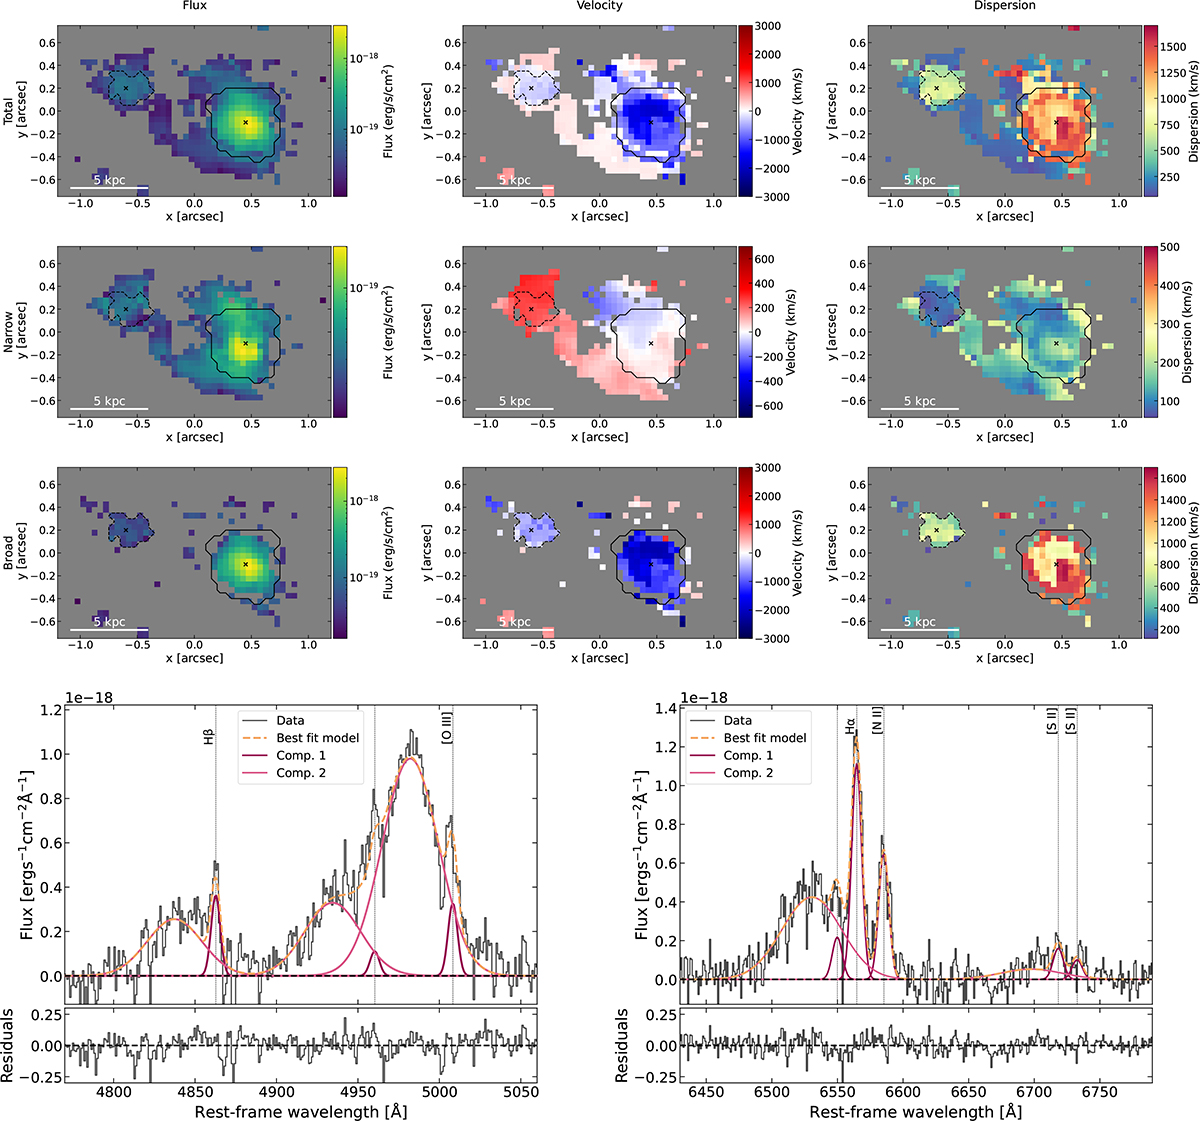
Fig. 3.
Download original image
Top: Hα maps of COS1638 AGNi A and B. From top to bottom: Total, narrow, and broad components. From left to right: Flux, velocity, and velocity dispersion. Solid (dashed) black contours mark the outflow region used to produce the outflow-integrated spectra of COS1638-A (COS1638-B). Bottom: Close-up on the Hβ+[O III] complex (left) and the Hα+[N II]+[S II] complex (right) of the continuum- and BLR-subtracted spectrum of COS1638 AGN A integrated over the S/N>3 mask of the broad [O III] emission at the position of AGN A (solid black line). Data and residuals are in black, total model is in dashed orange, single-line components are shown as dark to light purple. Component 1 corresponds to the narrow component; additional components add up to the broad component (component 2).
Current usage metrics show cumulative count of Article Views (full-text article views including HTML views, PDF and ePub downloads, according to the available data) and Abstracts Views on Vision4Press platform.
Data correspond to usage on the plateform after 2015. The current usage metrics is available 48-96 hours after online publication and is updated daily on week days.
Initial download of the metrics may take a while.