Open Access
Fig. 9
Download original image
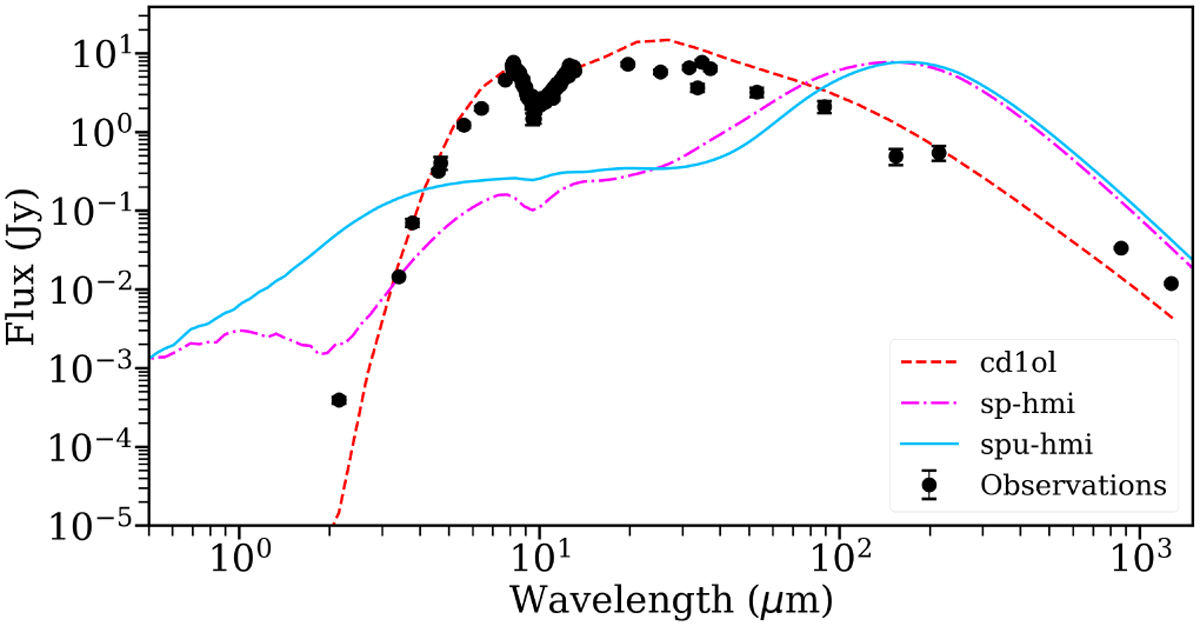
Hyperion best models and our RADMC-3D best model (cd1ol) overlaid on the observed SED. In magenta and blue, respectively, we plot the best-fitting Hyperion models using the SED Fitter for the sphmi and spu-hmi model sets. The Hyperion models are normalised and scaled up to the maximum flux in the observed SED.
Current usage metrics show cumulative count of Article Views (full-text article views including HTML views, PDF and ePub downloads, according to the available data) and Abstracts Views on Vision4Press platform.
Data correspond to usage on the plateform after 2015. The current usage metrics is available 48-96 hours after online publication and is updated daily on week days.
Initial download of the metrics may take a while.