Fig. 8
Download original image
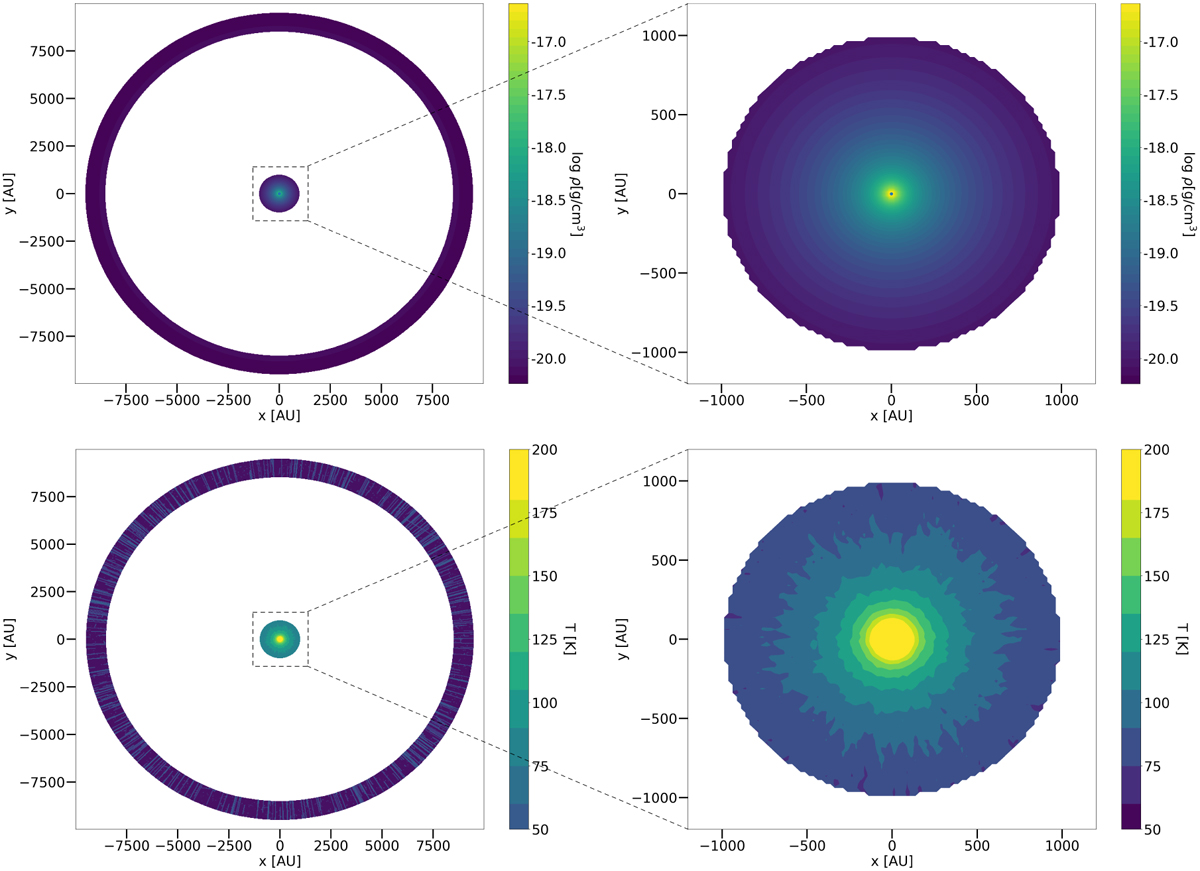
Plots indicating the physical structure of model cd1ol. The top and bottom rows show the dust density and temperature, respectively, whilst the left and right columns show the structure across the full extent of the model and zoomed in to the inner shell only, respectively. The concentric rays are the result of imperfect sampling with the Monte Carlo methods.
Current usage metrics show cumulative count of Article Views (full-text article views including HTML views, PDF and ePub downloads, according to the available data) and Abstracts Views on Vision4Press platform.
Data correspond to usage on the plateform after 2015. The current usage metrics is available 48-96 hours after online publication and is updated daily on week days.
Initial download of the metrics may take a while.