Fig. 3
Download original image
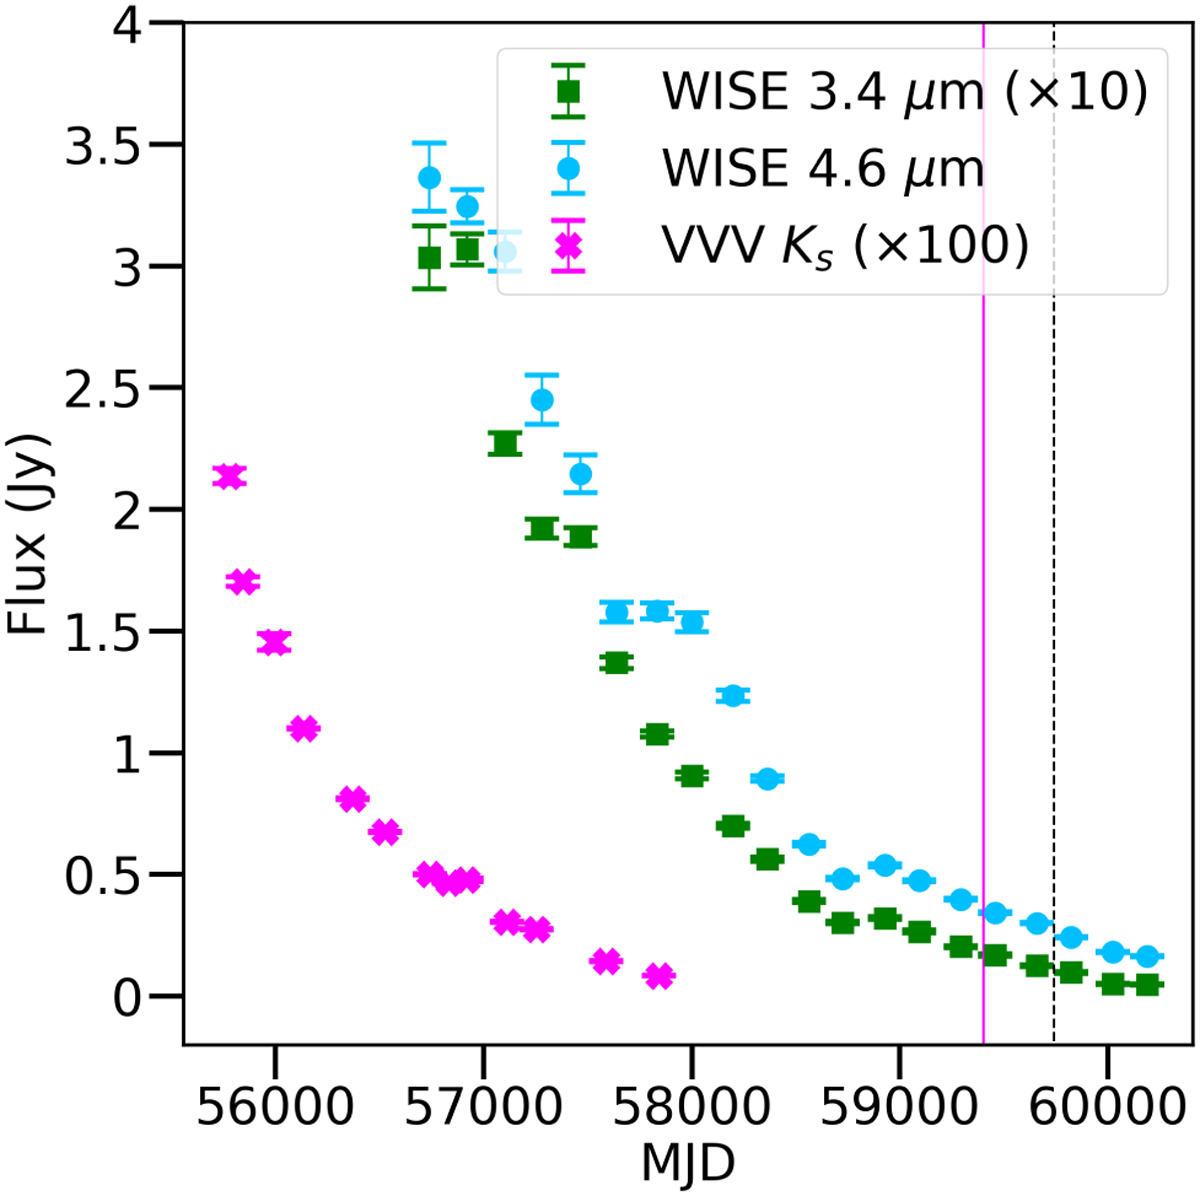
Light curve of BLG-360 at 3.4 μm (green) and 4.6 μm (blue), observed with NEOWISE between 2014 and 2023. The 3.4 μm light curve is scaled up by a factor of ten. Also included is the VVV Ks light curve at 2.15 μm, extracted between 2010 and 2016, and scaled up by a factor of 100. The vertical magenta and black lines indicate the epochs for the SOFIA FORCAST and HAWC+ observations, respectively.
Current usage metrics show cumulative count of Article Views (full-text article views including HTML views, PDF and ePub downloads, according to the available data) and Abstracts Views on Vision4Press platform.
Data correspond to usage on the plateform after 2015. The current usage metrics is available 48-96 hours after online publication and is updated daily on week days.
Initial download of the metrics may take a while.