Open Access
Fig. B.1
Download original image
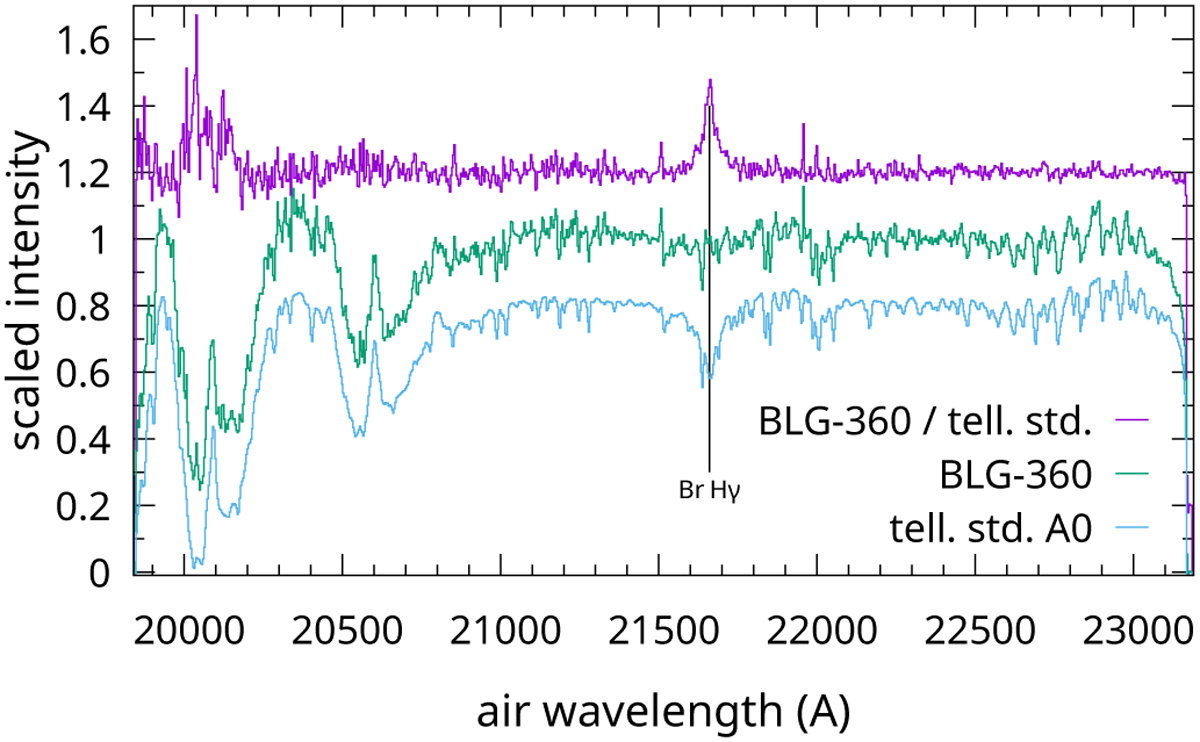
K-band Gemini spectrum of BLG-360 (green) is compared to a telluric standard (blue). The top plot shows the BLG-360 spectrum divided by that of the standard. The Bracket γ line shows up because it is a feature in the standard’s spectrum. No lines intrinsic to BLG-360 can be seen.
Current usage metrics show cumulative count of Article Views (full-text article views including HTML views, PDF and ePub downloads, according to the available data) and Abstracts Views on Vision4Press platform.
Data correspond to usage on the plateform after 2015. The current usage metrics is available 48-96 hours after online publication and is updated daily on week days.
Initial download of the metrics may take a while.