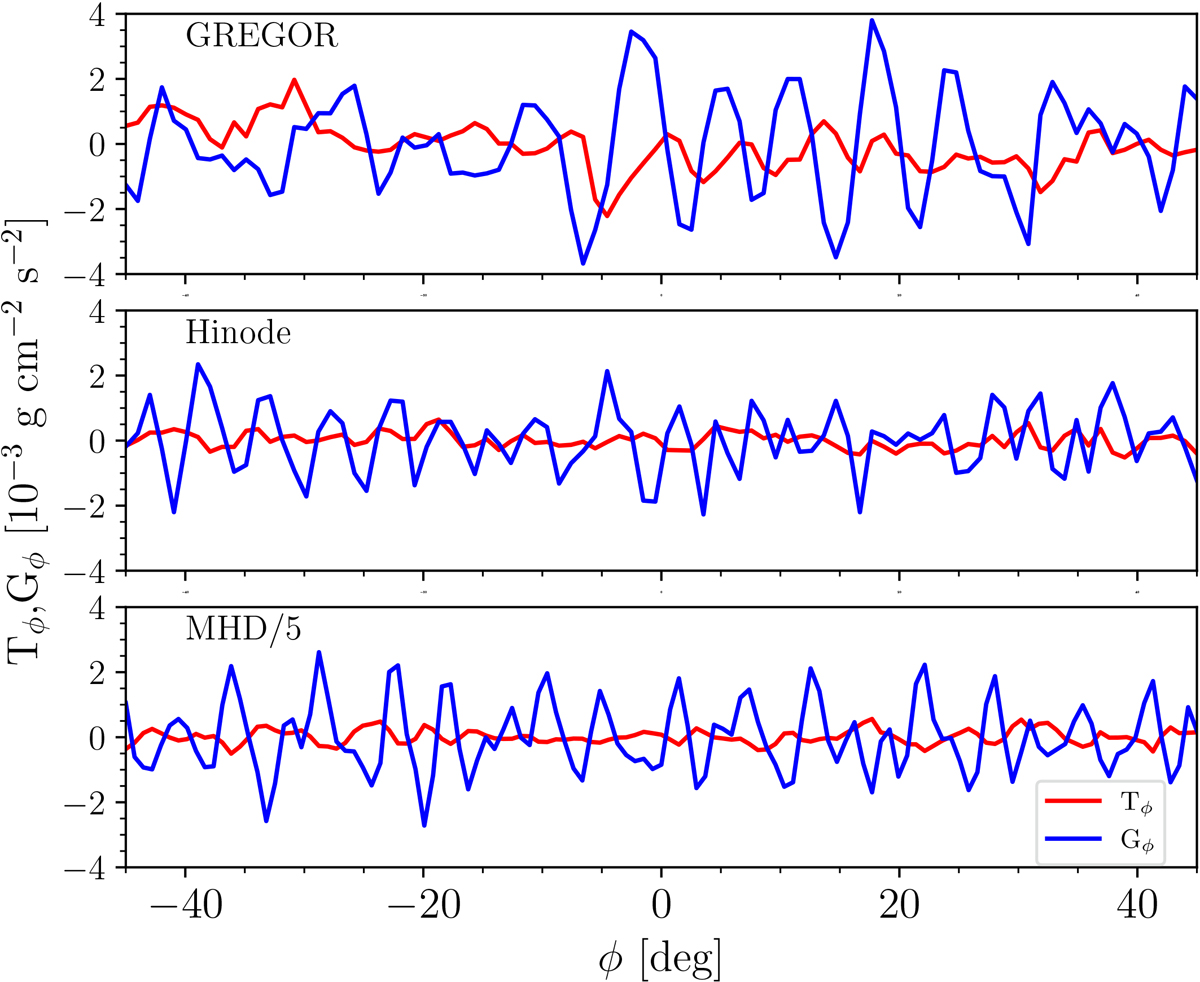
Fig. 4.
Download original image
Decomposition of the Lorentz force into magnetic pressure gradient and magnetic tension. Variations in the magnetic pressure gradient, Gϕ, (blue) and magnetic tension, Tϕ, (red) along the azimuthal coordinate, ϕ, are indicated in Fig. 2 (outermost arc) and were inferred from GREGOR (top) and Hinode (middle) observations, as well as from 3D MHD simulations (bottom). Values for the latter have been divided by a factor of five.
Current usage metrics show cumulative count of Article Views (full-text article views including HTML views, PDF and ePub downloads, according to the available data) and Abstracts Views on Vision4Press platform.
Data correspond to usage on the plateform after 2015. The current usage metrics is available 48-96 hours after online publication and is updated daily on week days.
Initial download of the metrics may take a while.