Fig. 5
Download original image
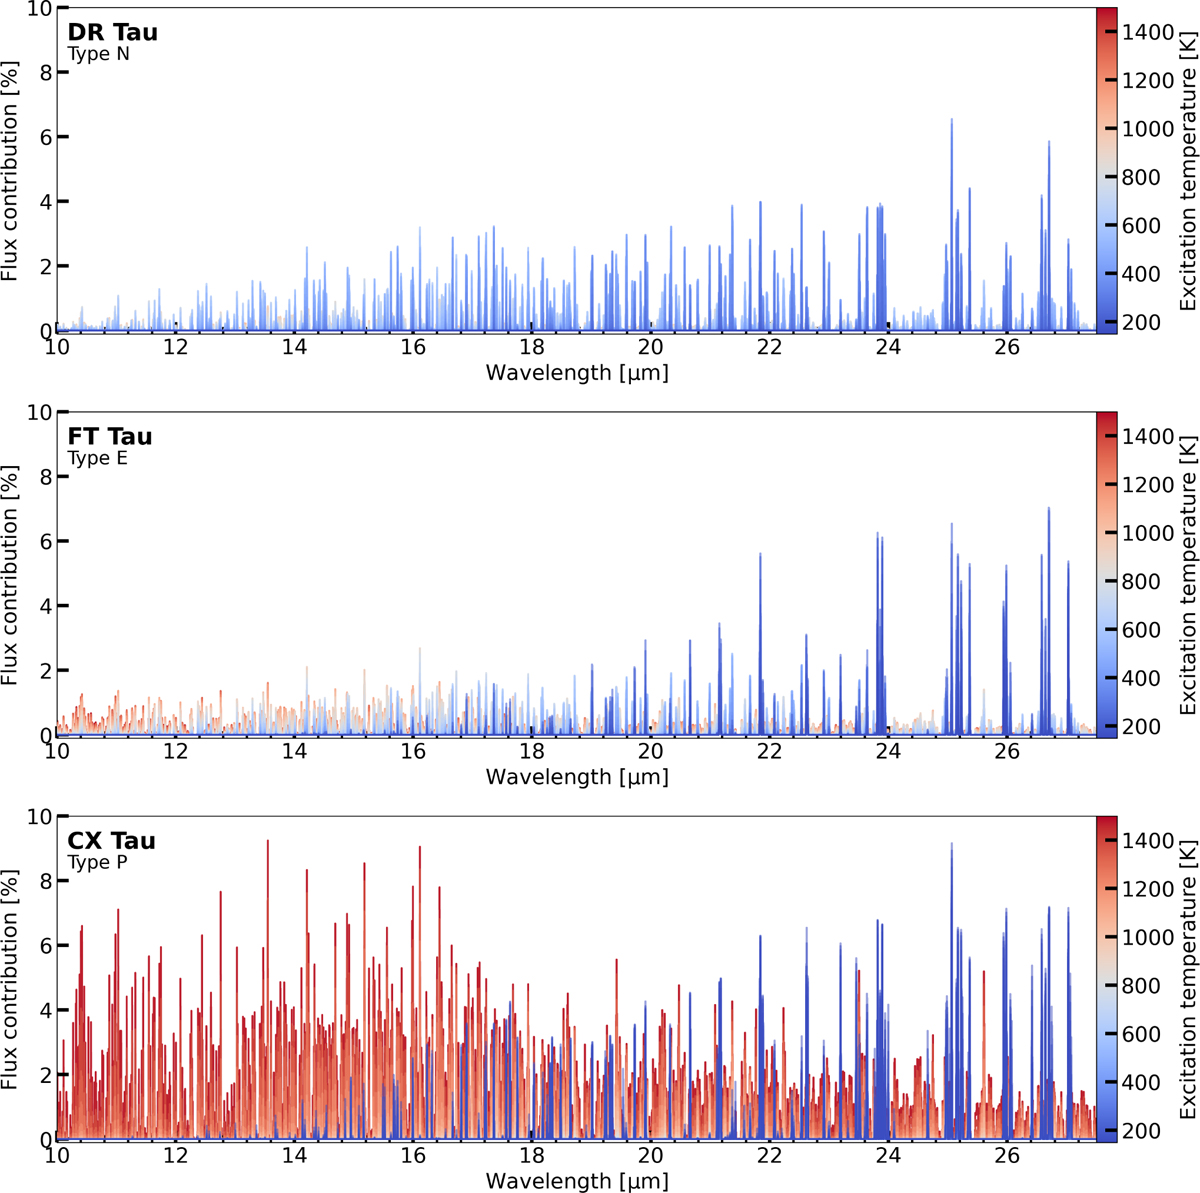
Contributions of each individual slab model with the colour representing the excitation temperature of the respective slab. The contributions are shown for the best fitting parametric models of DR Tau (type N), FT Tau (type E), and CX Tau (type P). The contributions are taken as the percentage with respect to the maximum line flux in the full model. We note that the maximum line flux of CX Tau is at least a factor of 5 lower than that of the other two types.
Current usage metrics show cumulative count of Article Views (full-text article views including HTML views, PDF and ePub downloads, according to the available data) and Abstracts Views on Vision4Press platform.
Data correspond to usage on the plateform after 2015. The current usage metrics is available 48-96 hours after online publication and is updated daily on week days.
Initial download of the metrics may take a while.