Fig. 4
Download original image
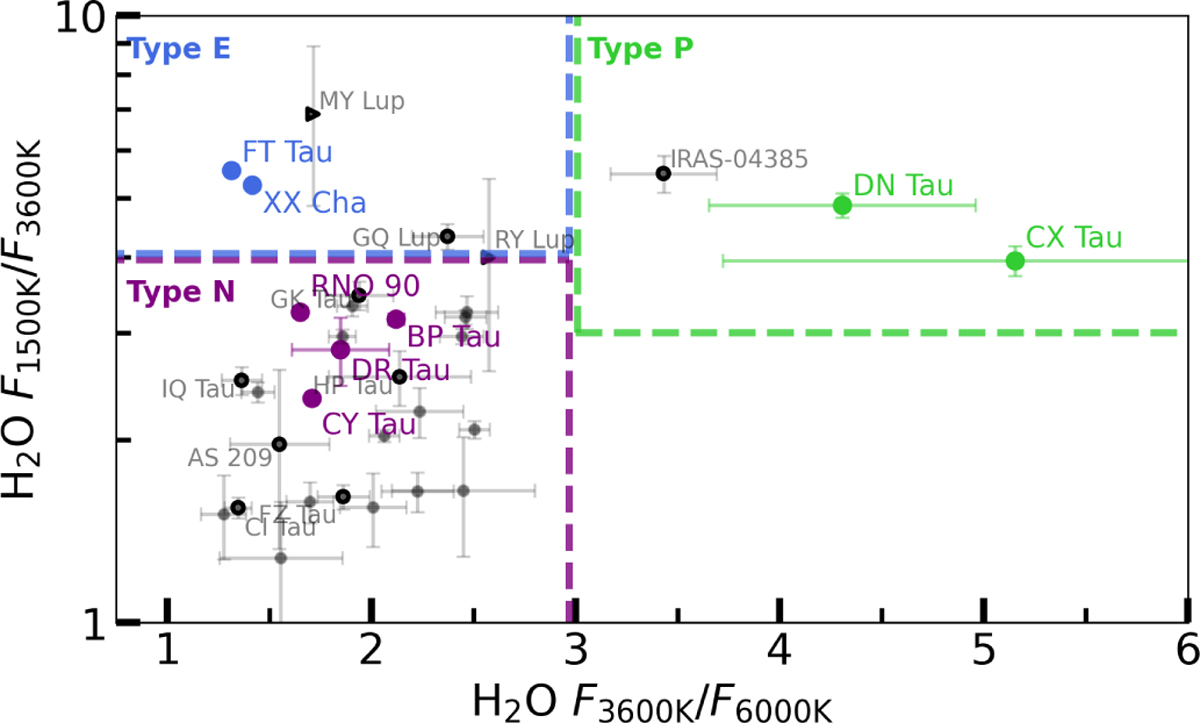
Ratios of the 3600 K/6000 K and 1500 K/3600 K line fluxes, used to investigate the respective strength of each H2O reservoir. The grey data points are adapted from Banzatti et al. (2025) (see their Table 3), where we have highlighted those analysed by Romero-Mirza et al. (2024) and potential type P sources (i.e. MY Lup, RY Lup and IRAS-04385). The coloured data points indicate the line ratios of our sample of compact discs. See Section 5.1 for a discussion on the different types.
Current usage metrics show cumulative count of Article Views (full-text article views including HTML views, PDF and ePub downloads, according to the available data) and Abstracts Views on Vision4Press platform.
Data correspond to usage on the plateform after 2015. The current usage metrics is available 48-96 hours after online publication and is updated daily on week days.
Initial download of the metrics may take a while.