Fig. 1
Download original image
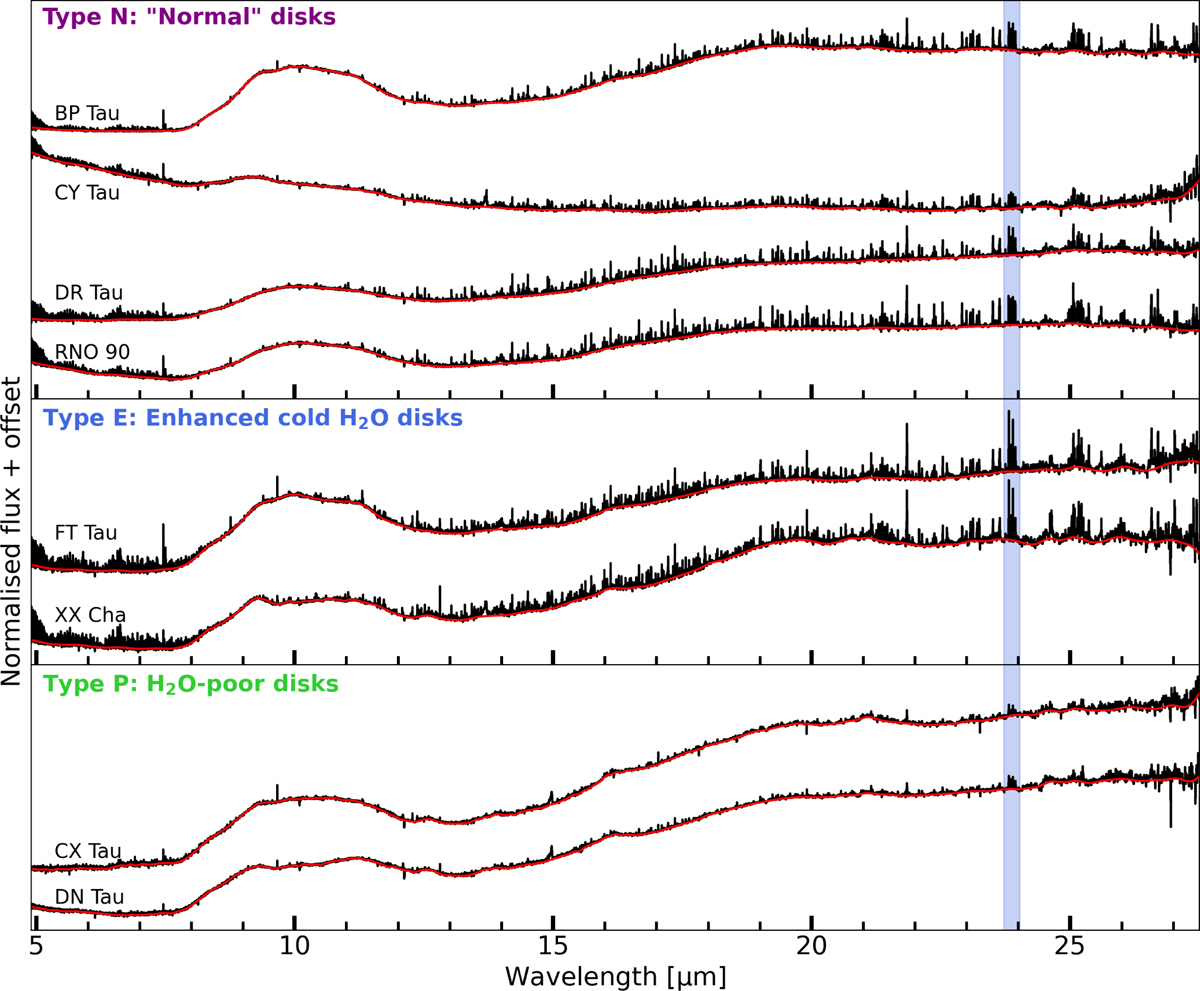
Normalised-to-peak-flux spectra of our sample of millimetre-compact discs. The red line indicates the estimated continuum. The indicated types and their meaning are discussed in Section 5.1. In blue, we highlight the 23.72–24.03 µm wavelength region, where two transitions are located that are most important for obtaining information about the cold H2O reservoir.
Current usage metrics show cumulative count of Article Views (full-text article views including HTML views, PDF and ePub downloads, according to the available data) and Abstracts Views on Vision4Press platform.
Data correspond to usage on the plateform after 2015. The current usage metrics is available 48-96 hours after online publication and is updated daily on week days.
Initial download of the metrics may take a while.