Open Access
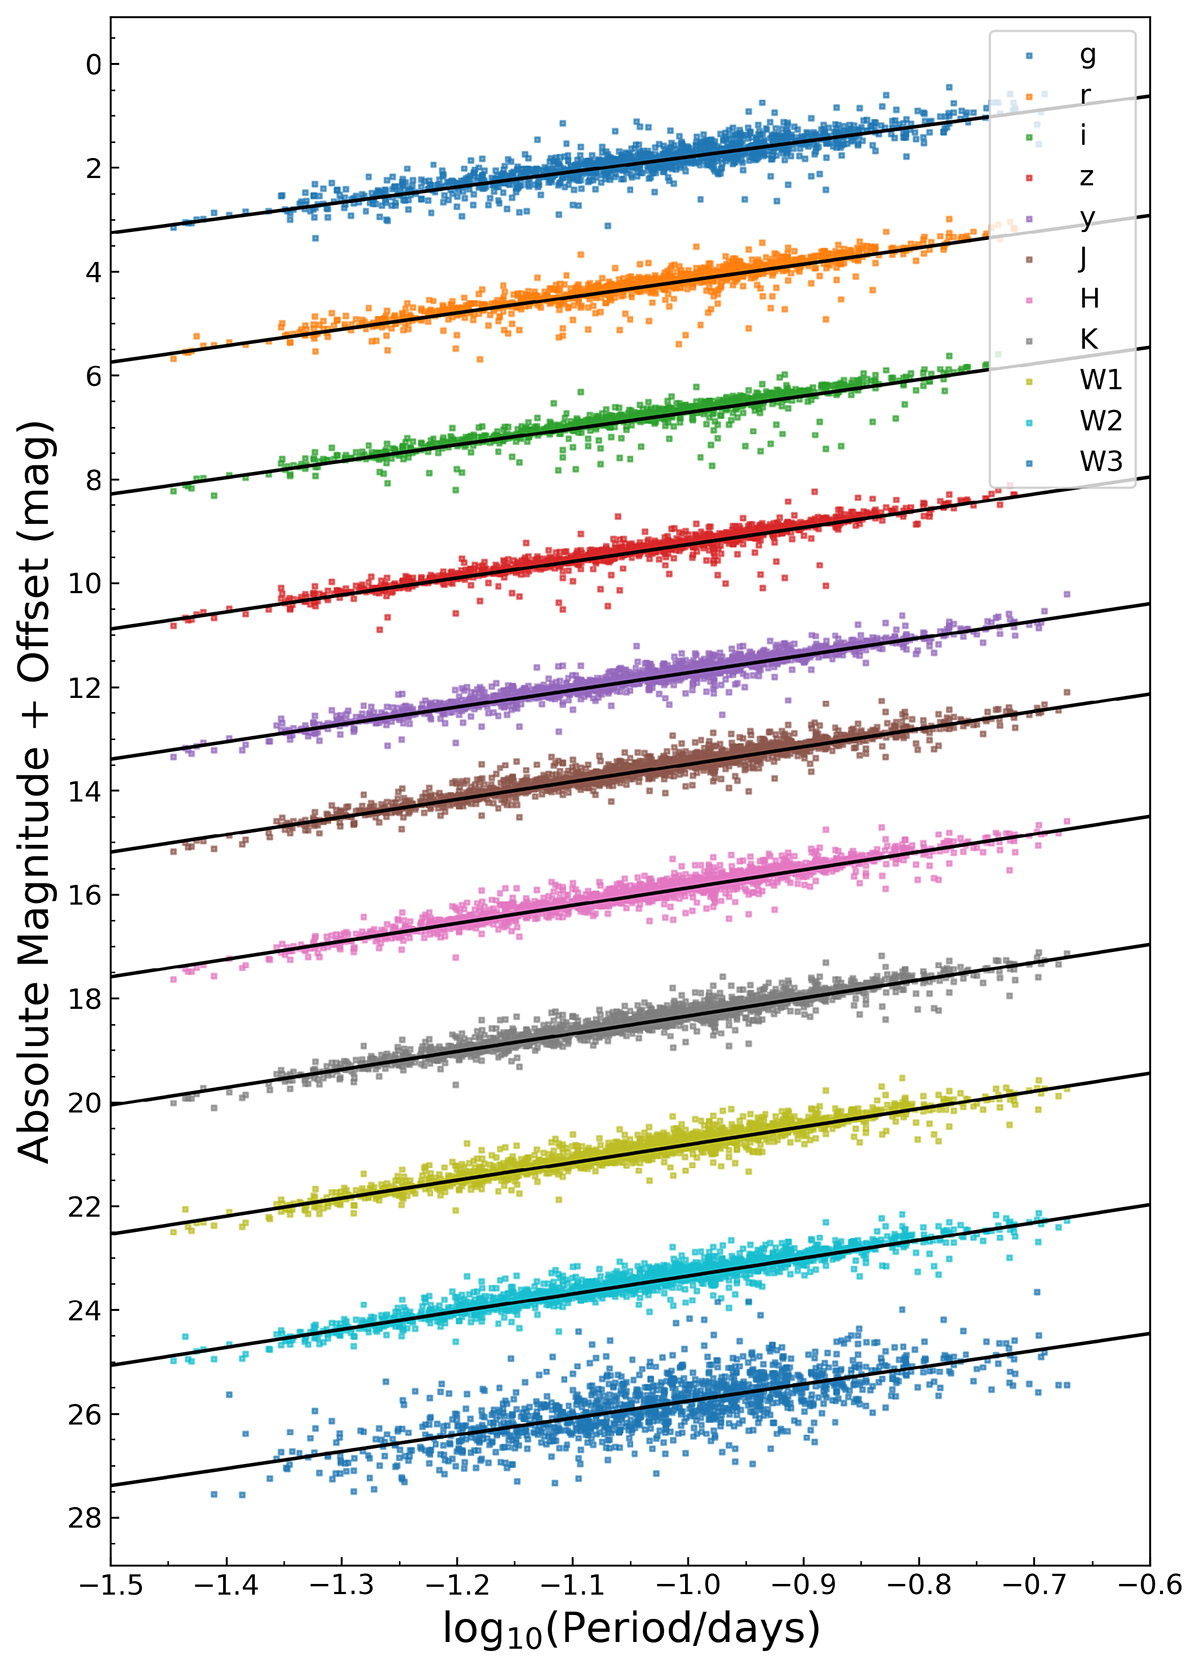
Fig. 6.
Download original image
P − L relations of δ Scuti stars in the 11 bands, as denoted by different colors. The zero points of the P − L relations are vertically shifted to visually separate each relation. The solid black lines represent the best-fitting P − L relations.
Current usage metrics show cumulative count of Article Views (full-text article views including HTML views, PDF and ePub downloads, according to the available data) and Abstracts Views on Vision4Press platform.
Data correspond to usage on the plateform after 2015. The current usage metrics is available 48-96 hours after online publication and is updated daily on week days.
Initial download of the metrics may take a while.