Open Access
Fig. 11.
Download original image
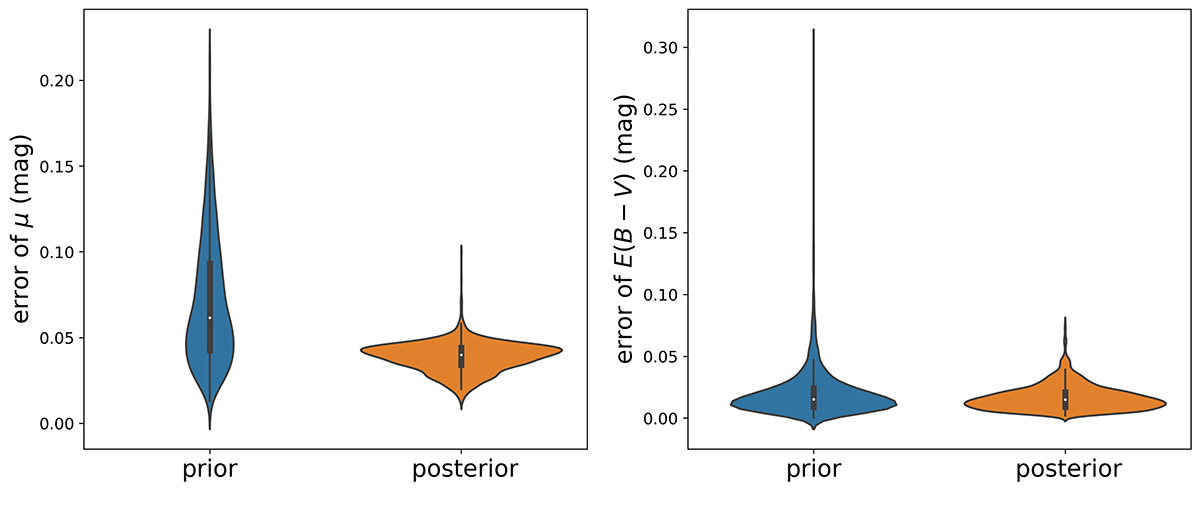
Violin plots depicting the prior and posterior error distribution for the distance modulus (left) and E(B − V) (right). The substantive depression in posterior distribution peaks relative to prior distributions shows a great error mitigation, particularly in measurements with larger initial uncertainties.
Current usage metrics show cumulative count of Article Views (full-text article views including HTML views, PDF and ePub downloads, according to the available data) and Abstracts Views on Vision4Press platform.
Data correspond to usage on the plateform after 2015. The current usage metrics is available 48-96 hours after online publication and is updated daily on week days.
Initial download of the metrics may take a while.