Fig. A.1
Download original image
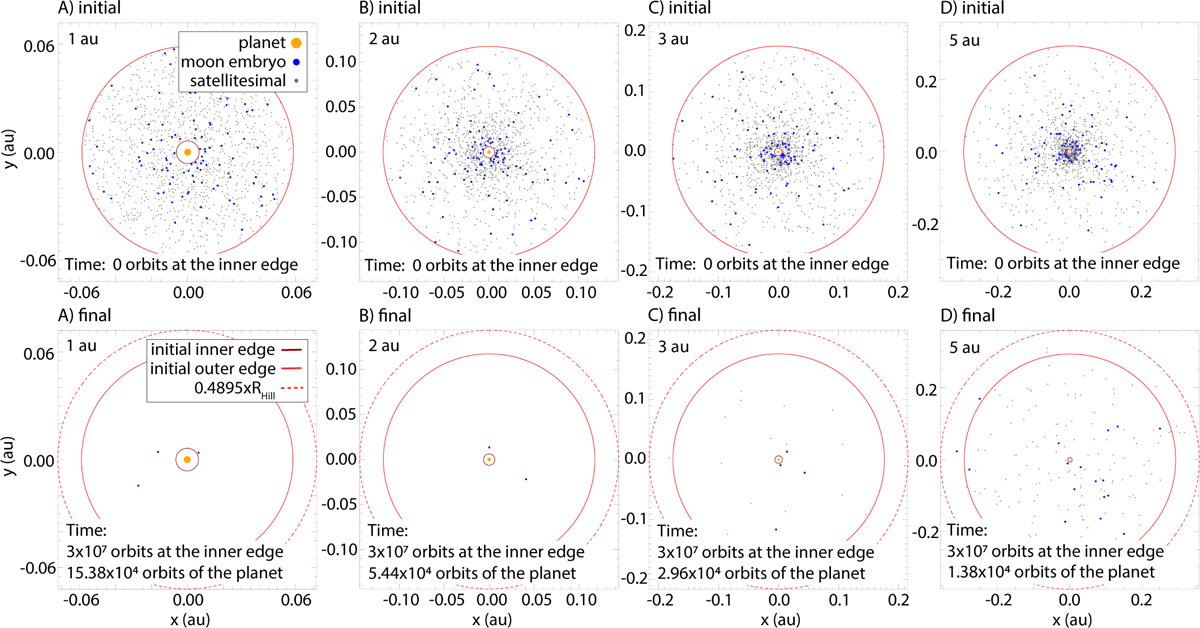
Distribution of the moon embryos (blue dots) and satellitesimals (gray dots) at the start (top panels) and the end (bottom panels) of the simulations in the face-on view of the protosatellite disks. Panels A, B, C, and D display the apl =1, 2, 3, and 5 au simulations. Orange dots correspond to the positions of the host planet. Brown and red circles indicate the initial inner and outer boundaries of the disks, respectively. Dashed red circle is the Domingos et al. (2006) suggested 0.4895 × Hill sphere’s outer edge. The time elapsed since the start of the simulations is shown at the bottom of each panel as a number of orbits at the inner edge of the circumplanetary disk, as well as, the orbit number of the host planet.
Current usage metrics show cumulative count of Article Views (full-text article views including HTML views, PDF and ePub downloads, according to the available data) and Abstracts Views on Vision4Press platform.
Data correspond to usage on the plateform after 2015. The current usage metrics is available 48-96 hours after online publication and is updated daily on week days.
Initial download of the metrics may take a while.