Fig. 5
Download original image
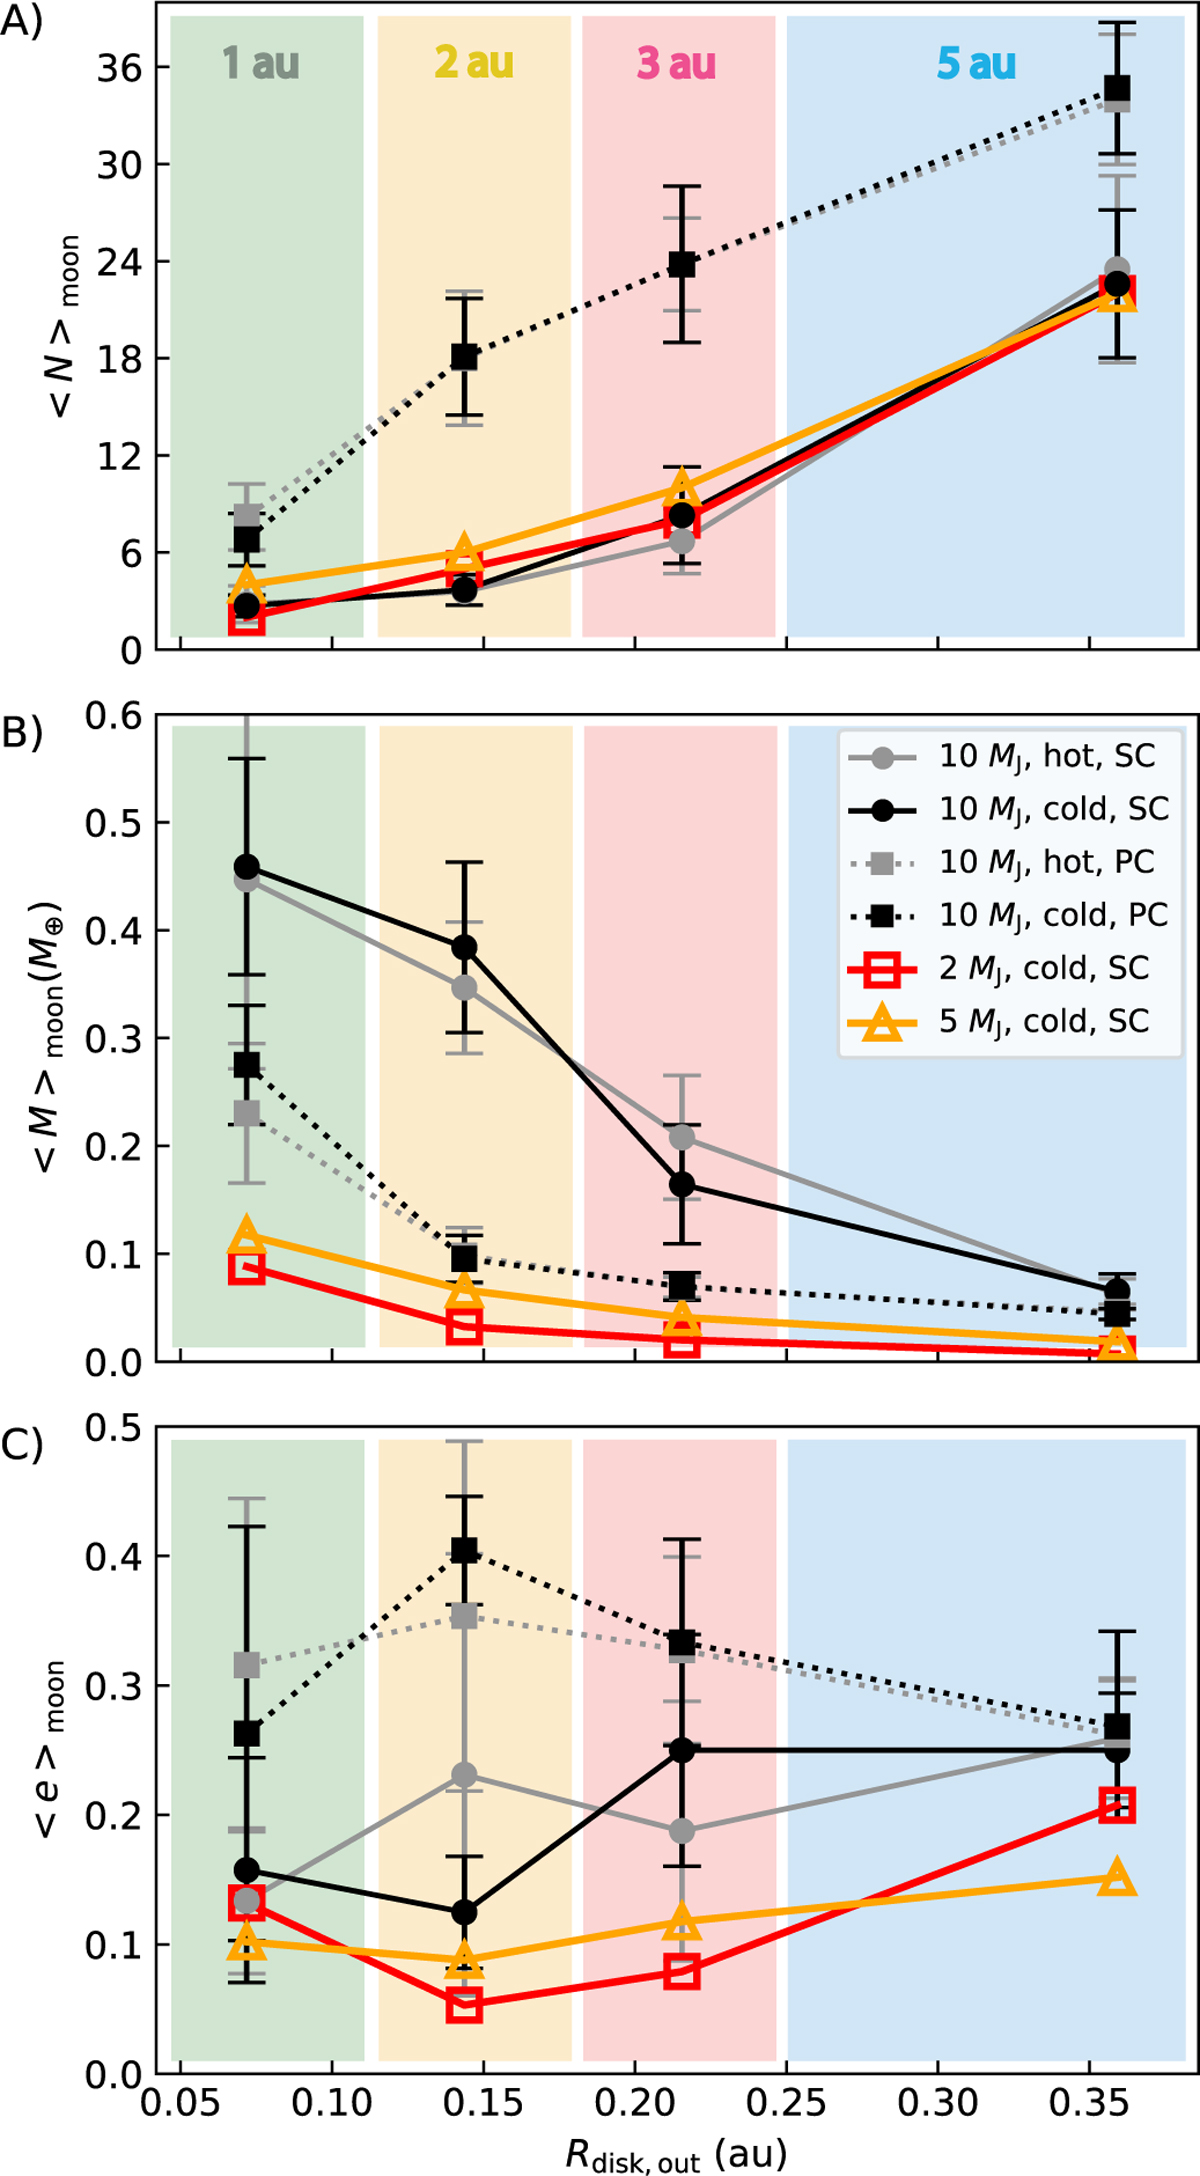
Properties of the formed moons as a function of the size of the circumplanetary disks. Panel A shows the average number, panel B shows the average individual mass, and panel C shows the average eccentricity of the moons. Solid and dotted lines display the SC and the PC simulations, respectively. Black and gray lines are the simulations with cold and hot disks around Mpl = 10 MJ host planets. Vertical error bars indicate the standard deviation from the average values, which come from 10 simulations for each disk size. Red and orange lines display simulations with Mpl = 2 MJ and 5 MJ host planets, respectively. The colors of the shading indicate the same stellar distances as in Fig. 3.
Current usage metrics show cumulative count of Article Views (full-text article views including HTML views, PDF and ePub downloads, according to the available data) and Abstracts Views on Vision4Press platform.
Data correspond to usage on the plateform after 2015. The current usage metrics is available 48-96 hours after online publication and is updated daily on week days.
Initial download of the metrics may take a while.