Fig. 4
Download original image
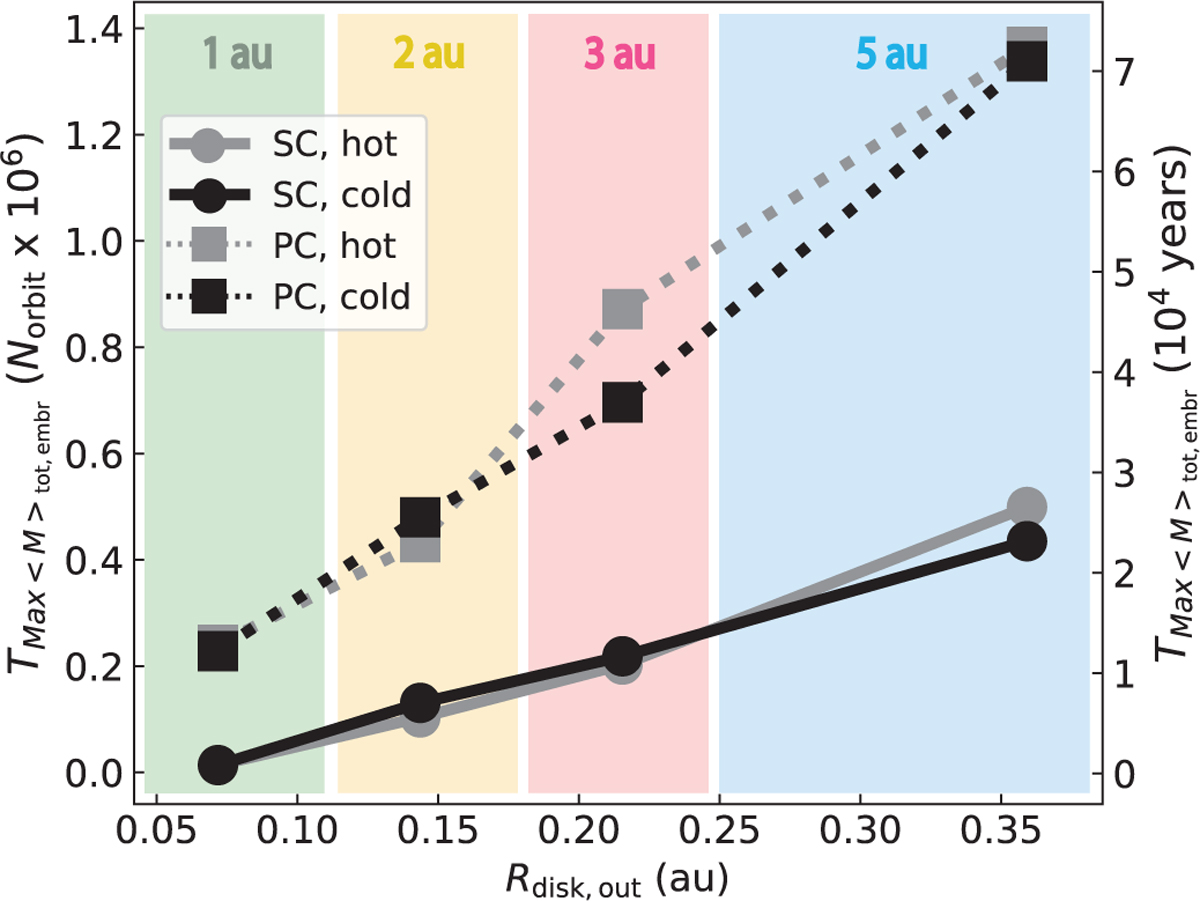
Time for the average total embryo mass to reach its maximum as a function of the size of the disks. The time is displayed in terms of the number of orbits at the inner edge of the CP disk on the left vertical axis as well as in years on the right vertical axis. The disk size is expressed as the distance of the disk’s outer edge from the 10 MJ host planet. Black and gray curves display the cold and the hot disks, respectively. Solid and dotted lines show the SC and PC scenario, respectively. The shading of the background color indicates the same stellar distances as in Fig. 3.
Current usage metrics show cumulative count of Article Views (full-text article views including HTML views, PDF and ePub downloads, according to the available data) and Abstracts Views on Vision4Press platform.
Data correspond to usage on the plateform after 2015. The current usage metrics is available 48-96 hours after online publication and is updated daily on week days.
Initial download of the metrics may take a while.