Fig. 3
Download original image
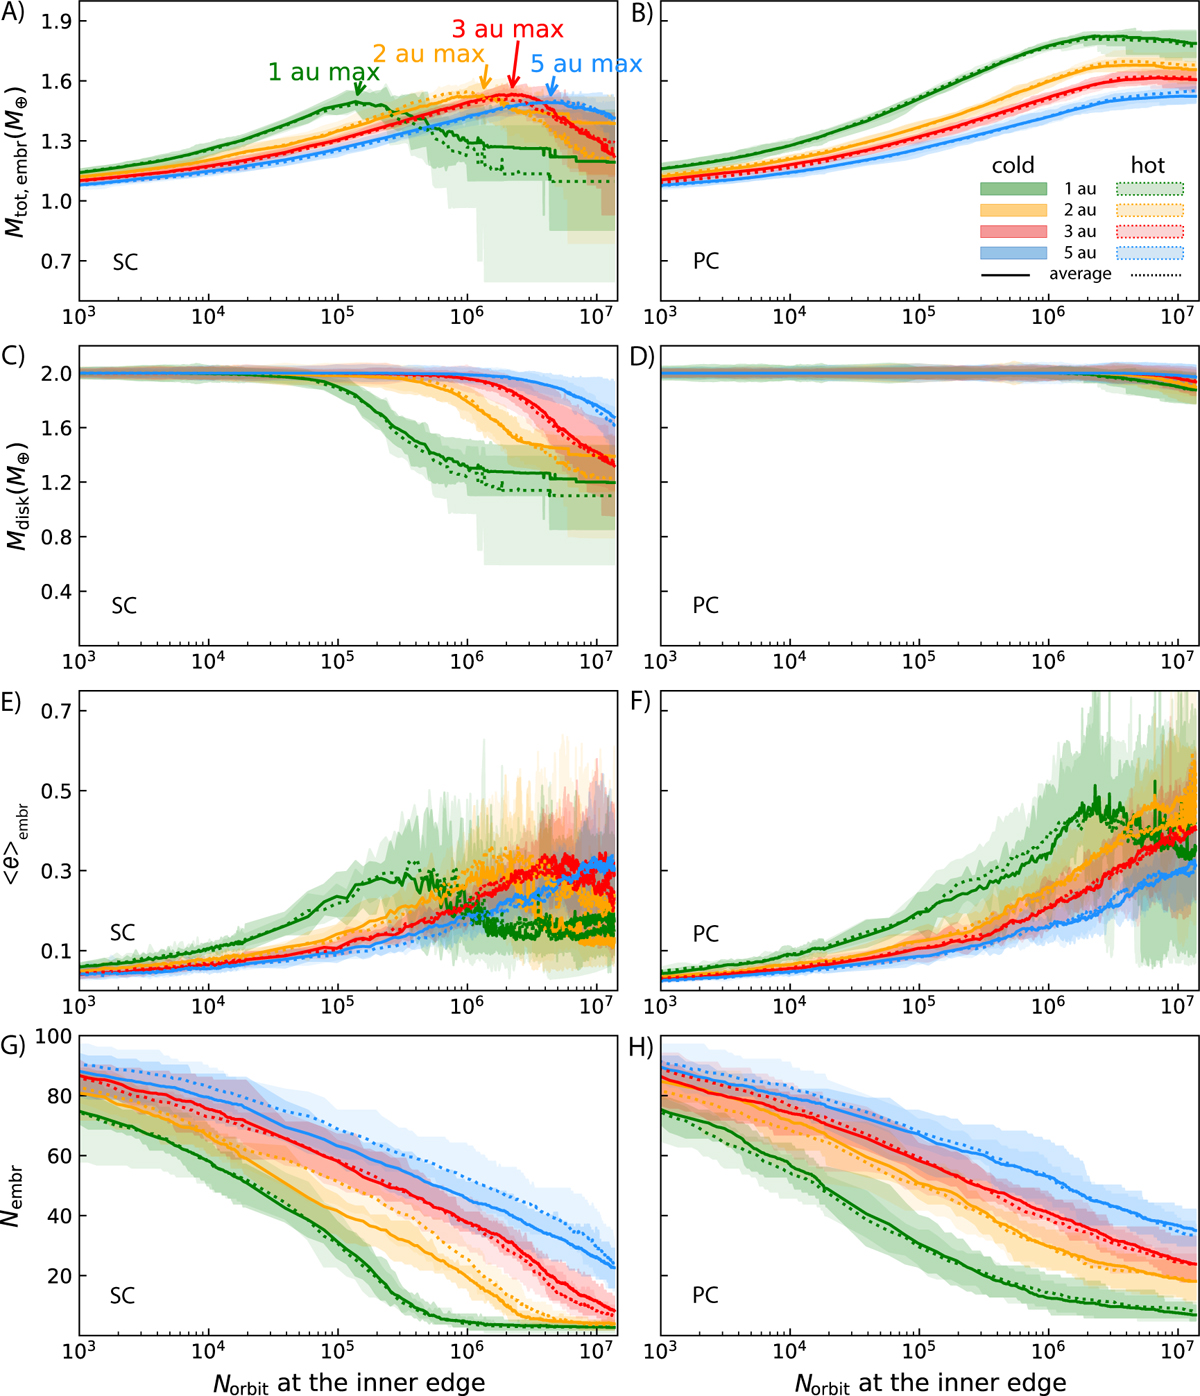
Evolution of the moon embryos and the protosatellite disks of 10 MJ host planets on a logarithmic timescale. The left and right panels show the SC and the PC scenarios, respectively. Green, yellow, red, and blue colors indicate the apl = 1, 2, 3, and 5 au simulations, respectively. Shaded regions represent the range between the minimum and maximum values from the ten simulations of each initial condition. Dark and light shadings indicate the initially cold and hot disks, respectively. Solid and dotted lines show the average values of the cold and the hot disk simulations. Panels A and B show the total embryo mass, panels C and D show the total disk mass, panels E and F show the average orbital eccentricity, and panels G and H show the number of embryos in the disks. All simulations start from the same level. Arrows indicate the maxima of the average total embryo masses in the SC scenario.
Current usage metrics show cumulative count of Article Views (full-text article views including HTML views, PDF and ePub downloads, according to the available data) and Abstracts Views on Vision4Press platform.
Data correspond to usage on the plateform after 2015. The current usage metrics is available 48-96 hours after online publication and is updated daily on week days.
Initial download of the metrics may take a while.