Fig. B.1
Download original image
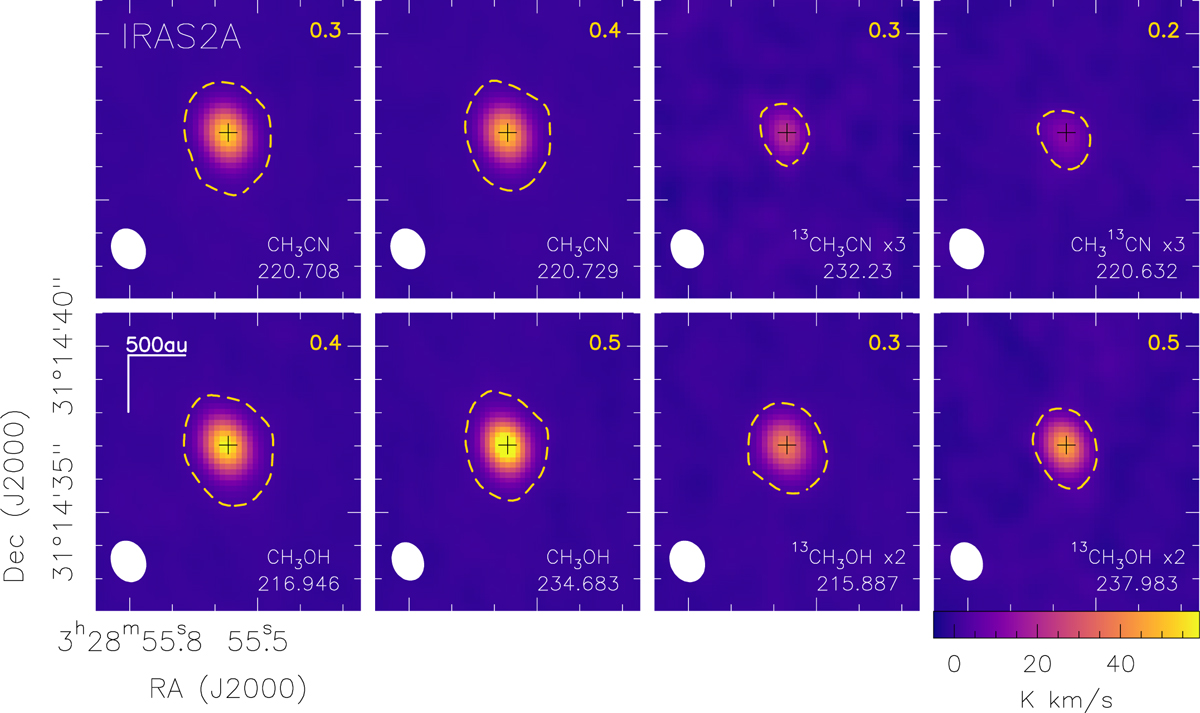
Integrated intensity maps using two transitions for both isotopologues of CH3 OH, the main CH3CN isotopologue, and one transition for each of the 13C isotopologue towards IRAS 2A. Respective rest frequencies (in GHz) are shown in the bottom-right corner, the beam (half power beam width, HPBW) on the bottom left. Multiplication factors (e.g. ×3, next to the species name) were applied to some species and transitions to be able to use the same intensity scale for all panels. The yellow dashed contour is at 5σ, where σ is the rms noise level (in K km s−1) and is written in the top-right corner.
Current usage metrics show cumulative count of Article Views (full-text article views including HTML views, PDF and ePub downloads, according to the available data) and Abstracts Views on Vision4Press platform.
Data correspond to usage on the plateform after 2015. The current usage metrics is available 48-96 hours after online publication and is updated daily on week days.
Initial download of the metrics may take a while.