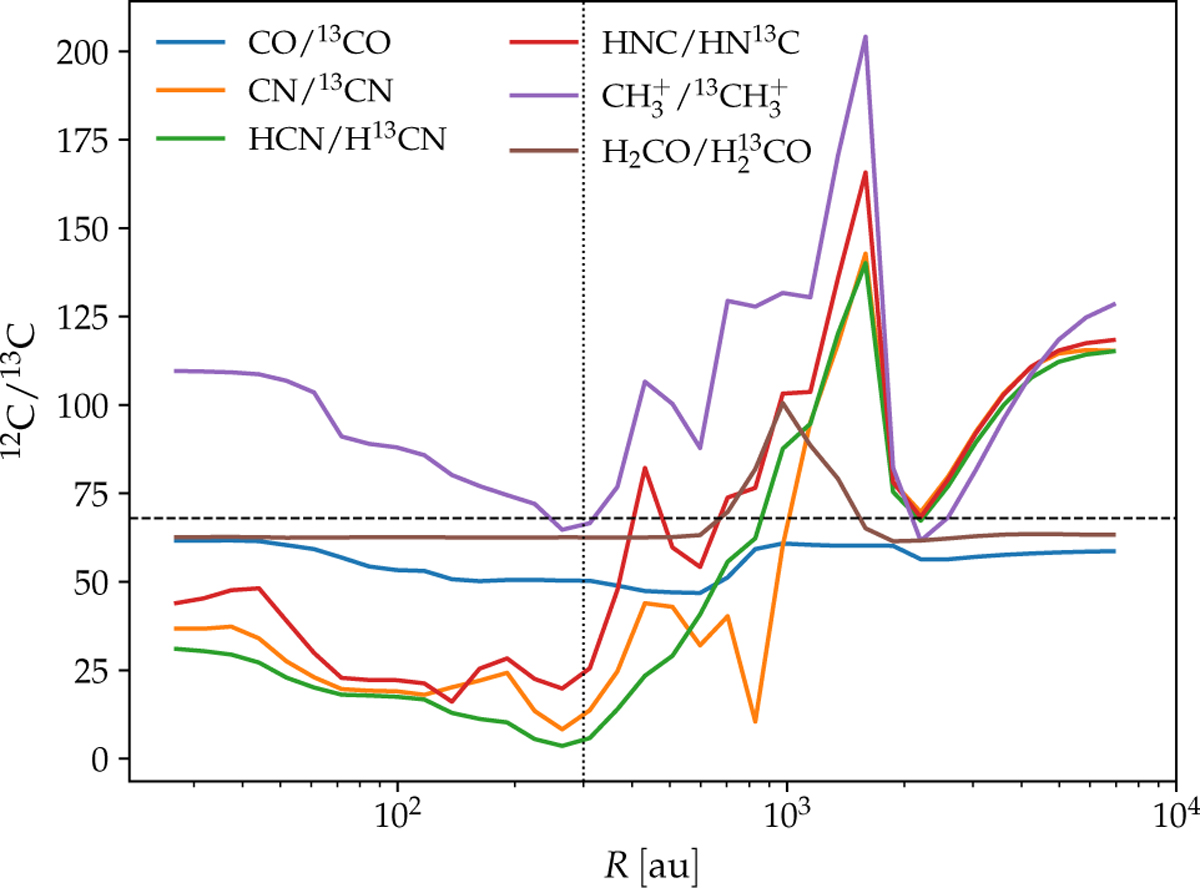
Fig. 7
Download original image
Model predictions for selected gas-phase 12C/13C ratios as a function of distance from the protostar taken at a simulation time of 104 yr. The constant ratio of 68 is indicated by the horizontal dashed black line. The vertical dotted black line separates the spatial scales discussed in this paper (R < 300 au) from the larger scales, which are not largely discussed but shown for completeness.
Current usage metrics show cumulative count of Article Views (full-text article views including HTML views, PDF and ePub downloads, according to the available data) and Abstracts Views on Vision4Press platform.
Data correspond to usage on the plateform after 2015. The current usage metrics is available 48-96 hours after online publication and is updated daily on week days.
Initial download of the metrics may take a while.