Fig. 9
Download original image
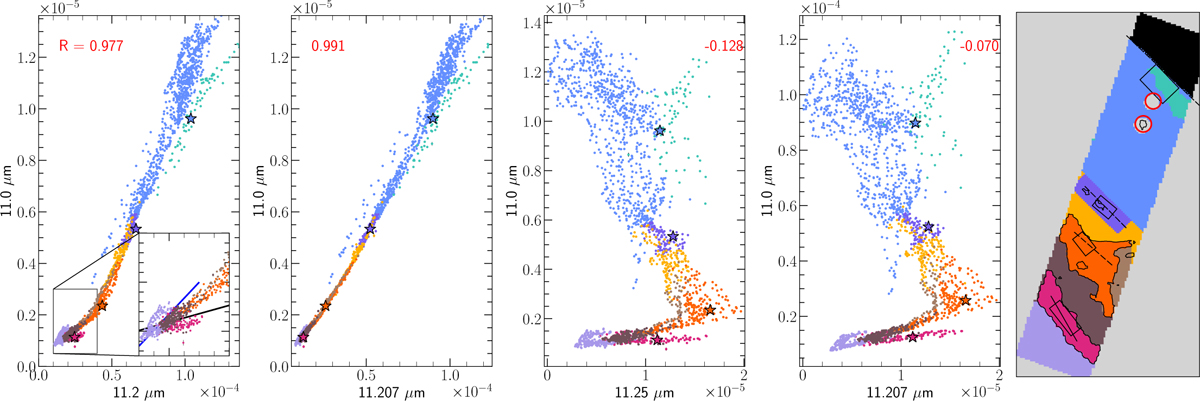
Correlations plots of the 11.0 µm AIB surface brightnesses versus the 11.2 µm (first panel), 11.207 µm (second panel) and 11.25 µm (third panel) surface brightnesses, and 11.207 µm vs. 11.25 µm (fourth panel) surface brightnesses in units of W m−2 sr−1, on the abscissa and ordinates, respectively. The correlation coefficient “R” for a linear correlation between the variables is displayed in red in the panels. The colored star symbols represent surface brightnesses for the four template spectra from the PDR (atomic PDR: blue; DF 1: purple; DF 2: orange; and DF 3: pink). The inset in the left panel shows a magnified view of the branching occurring at the lower extreme end. Only surface brightnesses with SNR > 3 from every other spaxel are considered. in the correlation analyses. The data points are colored according to regions in the mosaic where those pixels are located (fifth panel). This visual region-color scheme is as follows: blue (atomic PDR), teal (west IF), purple (DF 1), yellow (region between DF 1 and DF 2), orange (DF 2), light brown (region west of DF 2), brown (region between DF 2 and DF 3), pink (DF 3), and light purple (region beyond DF 3). The contours highlighting DF 2 and DF 3 are identified through enhanced emission of H2 0–0 S(3) in these dissociation fronts. The circular red regions on the color-region map (fifth panel) correspond to the proplyds, as these pixels have been masked in our data analysis.
Current usage metrics show cumulative count of Article Views (full-text article views including HTML views, PDF and ePub downloads, according to the available data) and Abstracts Views on Vision4Press platform.
Data correspond to usage on the plateform after 2015. The current usage metrics is available 48-96 hours after online publication and is updated daily on week days.
Initial download of the metrics may take a while.