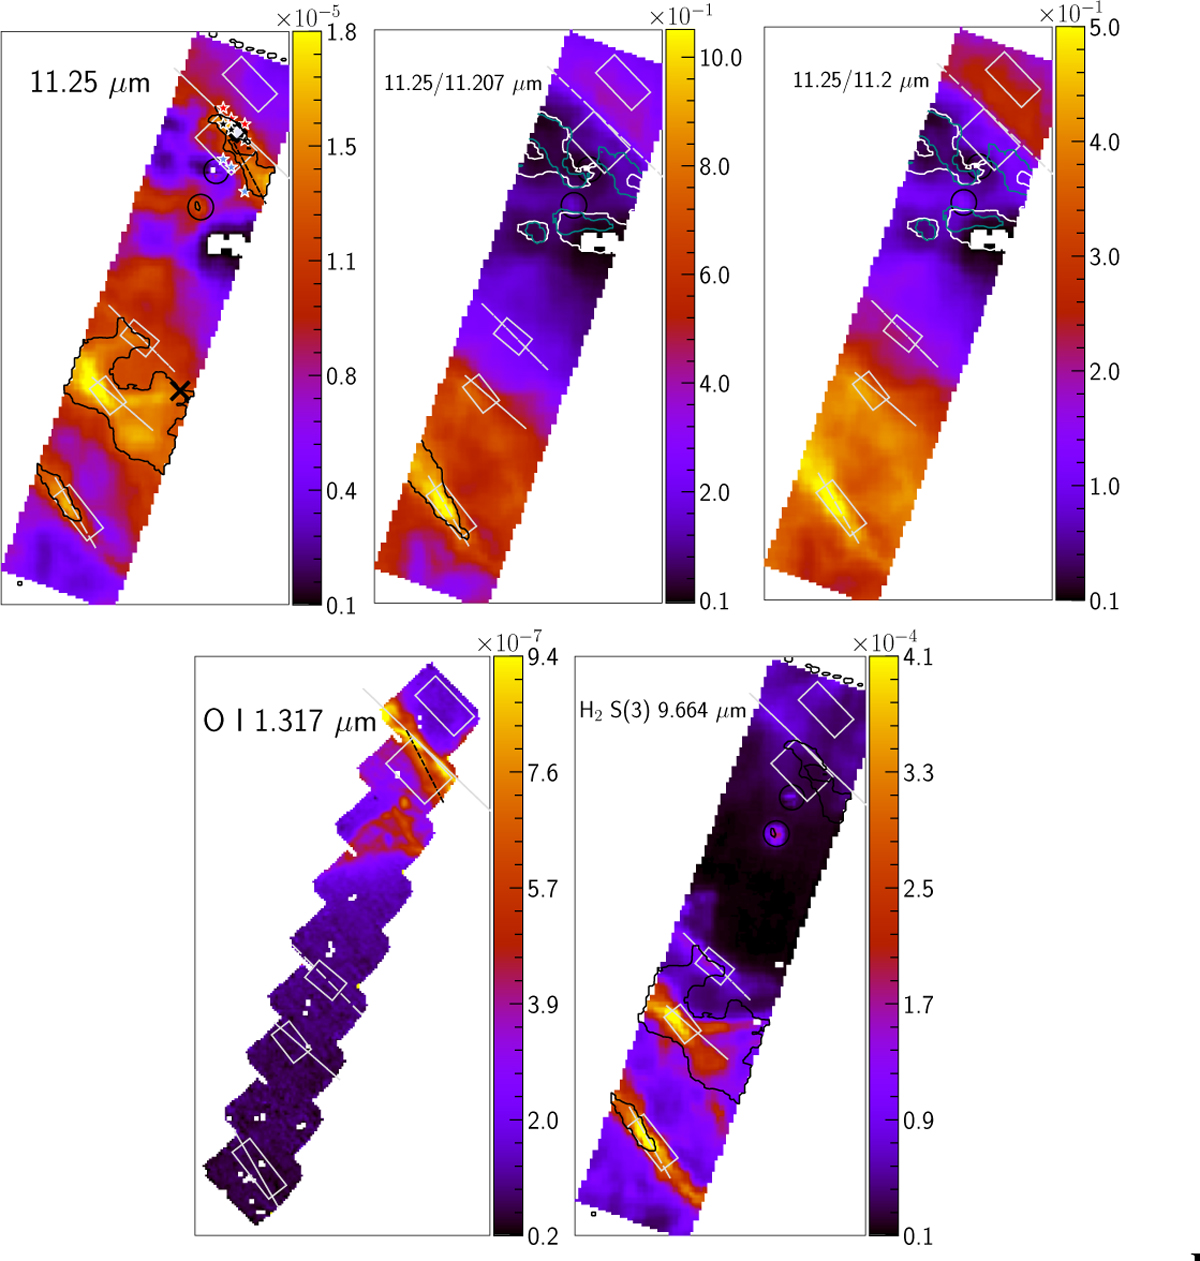
Fig. E.1
Download original image
Spatial distribution of the surface brightness [W m−2 sr−1] of the 11.25 µm AIB, the 11.25/11.207 µm and 11.25/11.2 µm surface brightness ratios, the O I 1.317 µm fluorescence line [erg cm−2 s−1 sr−1] from Peeters et al. (2024), and the H2 0-0 S(3) line [W m−2 sr−1] at 9.664 µm from Sidhu et al. (in prep.). The black contours in the top right panel correspond to I11.25 = 1.25 × 10⁻⁵ W m−2 sr−1. In the top middle and right panels, the white and teal contours trace peak emission for the 11.0 µm and the 11.2 µm band, respectively, and the black contour corresponds to a 11.25/11.207 ratio of 0.8. In the bottom left panel, the dashed black line represents the “secondary ridge” discussed in the text. θ1 Ori C is located toward the top right of each map (see Fig. 2). In each map the range of the corresponding color bar is set between 0.5% and 99.5% percentile level for the data. The zero pixels, and in the maps based on the MIRI FOV, the edge pixels, and pixels covering the two proplyds, indicated by the black circles, are masked out. The rectangular apertures of the template spectra for the H II region, atomic PDR, DF 1, DF 2, and DF 3, from top to bottom, are shown in white and the solid white lines delineate the IF and the three DFs, DF 1, DF 2 and DF 3.
Current usage metrics show cumulative count of Article Views (full-text article views including HTML views, PDF and ePub downloads, according to the available data) and Abstracts Views on Vision4Press platform.
Data correspond to usage on the plateform after 2015. The current usage metrics is available 48-96 hours after online publication and is updated daily on week days.
Initial download of the metrics may take a while.