Fig. 3
Download original image
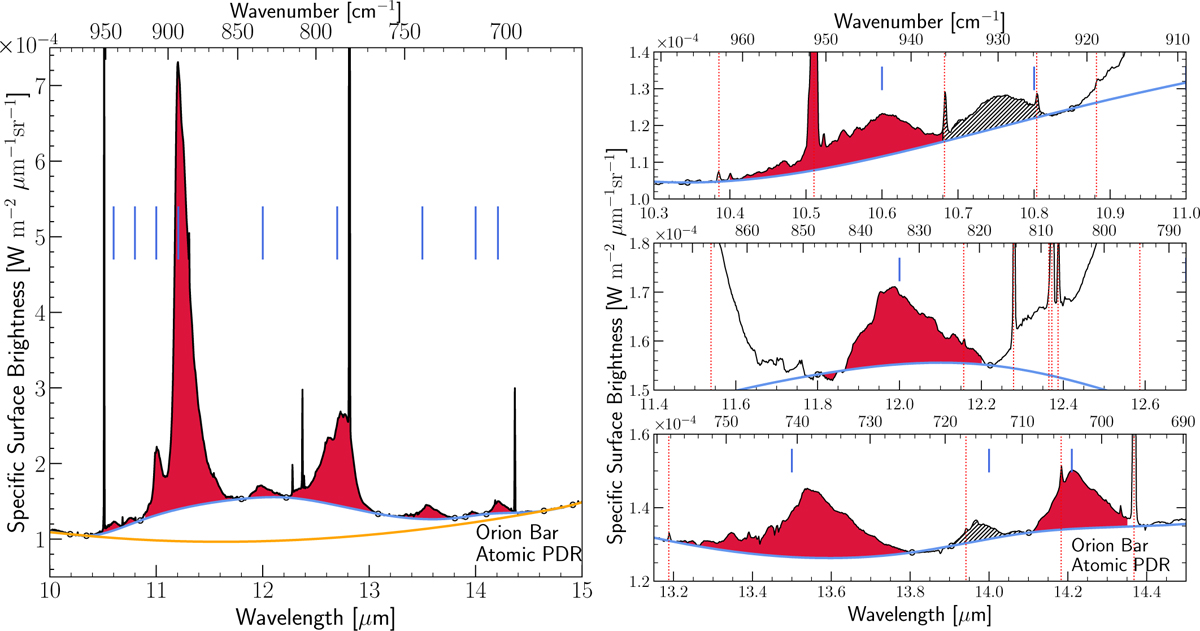
Left: AIB template spectrum in the 10–15 µm region emergent from the Orion Bar atomic PDR. The blue curve indicates the underlying local continuum (dust continuum + plateau), the orange curve indicates the global continuum, the black circular markers are placed at the anchor points used to estimate the continuum, and the vertical solid blue lines indicate the nominal AIBs at 11.0, 11.2, 12.0, 12.7, and 13.5 µm, and the weakest AIBs at 10.6, 10.8, 14.0, and 14.2 µm, which are each shaded in red. Right: closer look at the weak AIBs, where the vertical dotted markers indicate the positions of the atomic and H2 lines. Previously observed bands at 10.6, 12.0, 13.5, and 14.2 µm are shaded in red. We observe emergence of weaker, adjacent features to the 10.6 and 14.2 µm AIBs at 10.8 µm and 14.0 µm, respectively, which are marked by the hatch pattern.
Current usage metrics show cumulative count of Article Views (full-text article views including HTML views, PDF and ePub downloads, according to the available data) and Abstracts Views on Vision4Press platform.
Data correspond to usage on the plateform after 2015. The current usage metrics is available 48-96 hours after online publication and is updated daily on week days.
Initial download of the metrics may take a while.