Fig. 25
Download original image
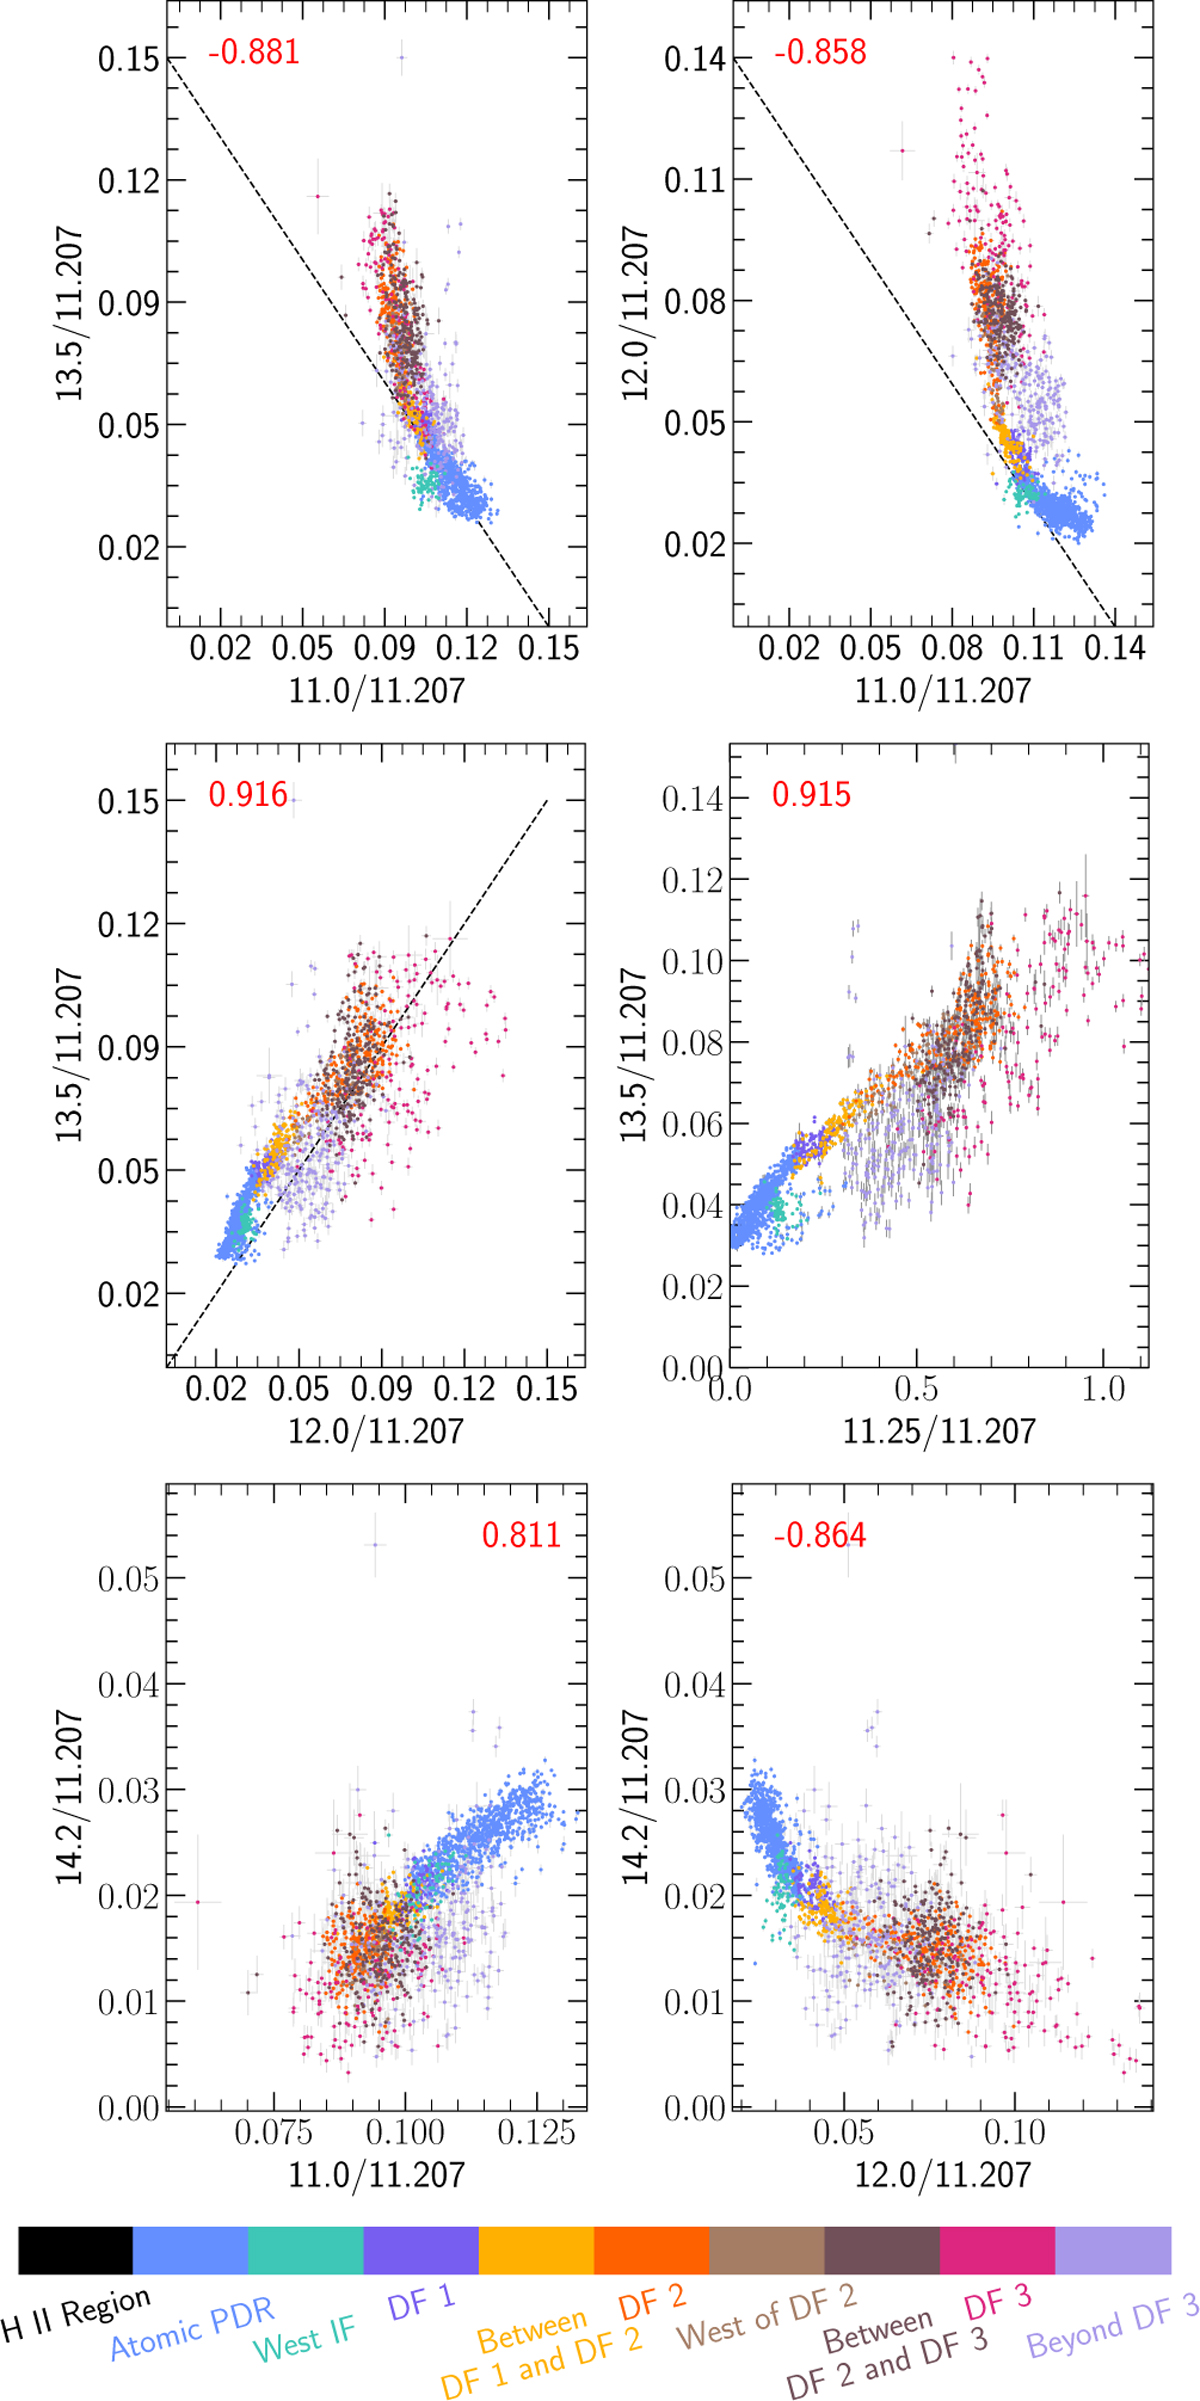
Correlation plots for the 13.5, 12.0, and 14.2 µm bands normalized to the 11.207 µm AIB. The red text displays the value of the correlation coefficient, R, for the data points plotted. The dotted black lines in the first three panels, represent either a positive or negative linear relationship between a set of two variables. The data points are colored according to regions in the mosaic where those pixels are located, per the color bar at the bottom.
Current usage metrics show cumulative count of Article Views (full-text article views including HTML views, PDF and ePub downloads, according to the available data) and Abstracts Views on Vision4Press platform.
Data correspond to usage on the plateform after 2015. The current usage metrics is available 48-96 hours after online publication and is updated daily on week days.
Initial download of the metrics may take a while.