Fig. 4.
Download original image
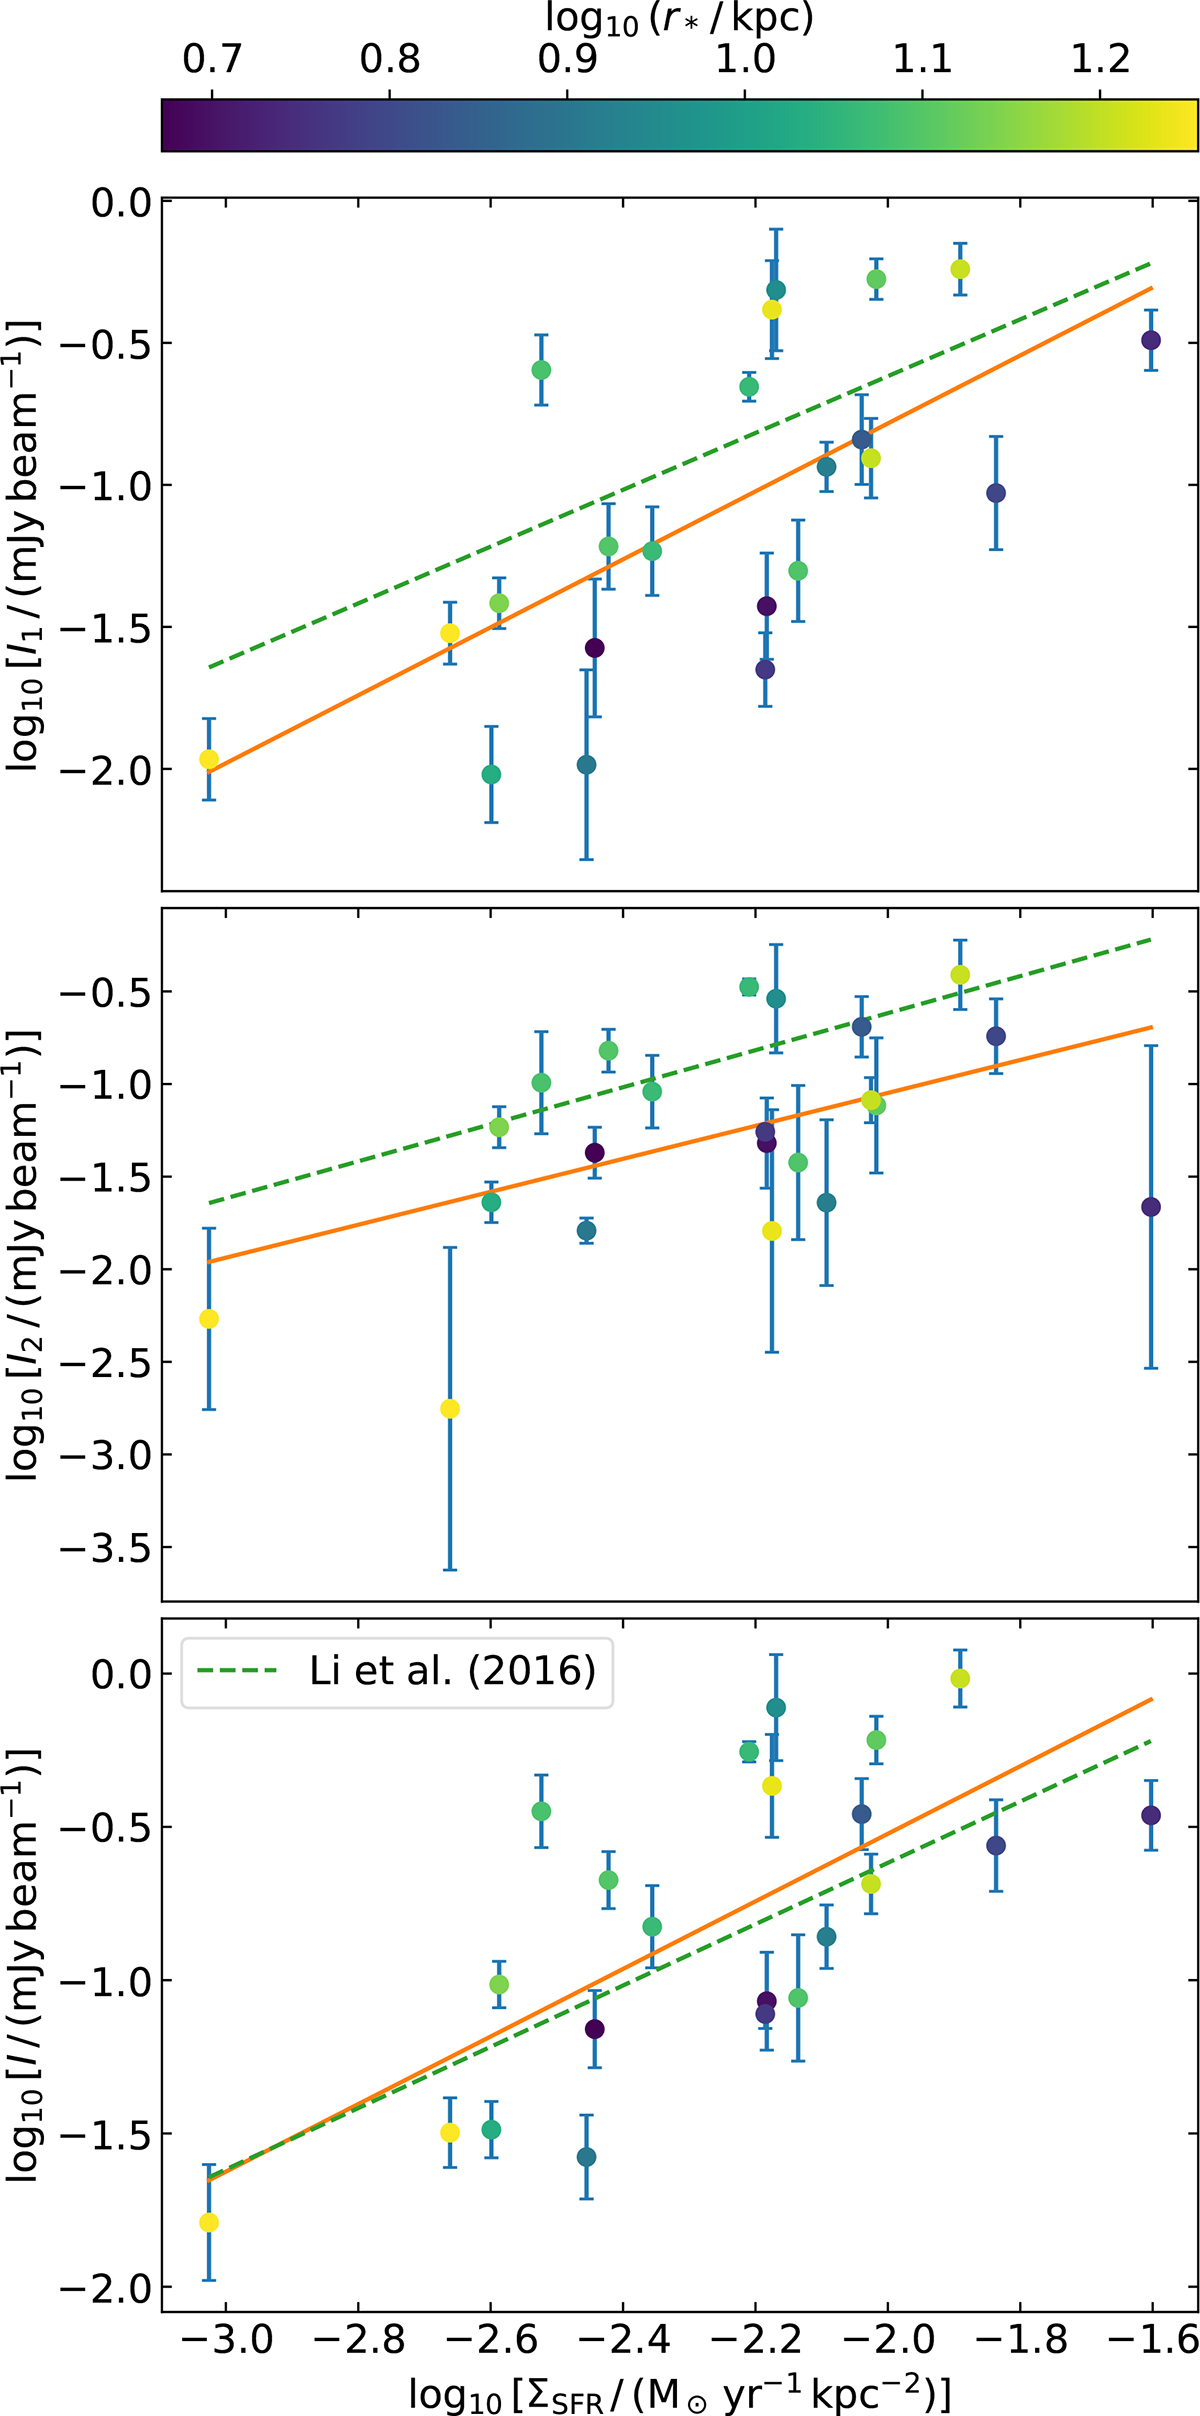
Deprojected mean intensities as function of SFR surface density. Best-fitting relations are shown as solid lines, and the relation for integrated luminosities is shown as a dashed line (Li et al. 2016). We show the relation in the thin disc (top panel), thick disc (middle panel), and combined thin and thick discs (bottom panel).
Current usage metrics show cumulative count of Article Views (full-text article views including HTML views, PDF and ePub downloads, according to the available data) and Abstracts Views on Vision4Press platform.
Data correspond to usage on the plateform after 2015. The current usage metrics is available 48-96 hours after online publication and is updated daily on week days.
Initial download of the metrics may take a while.