Fig. 1.
Download original image
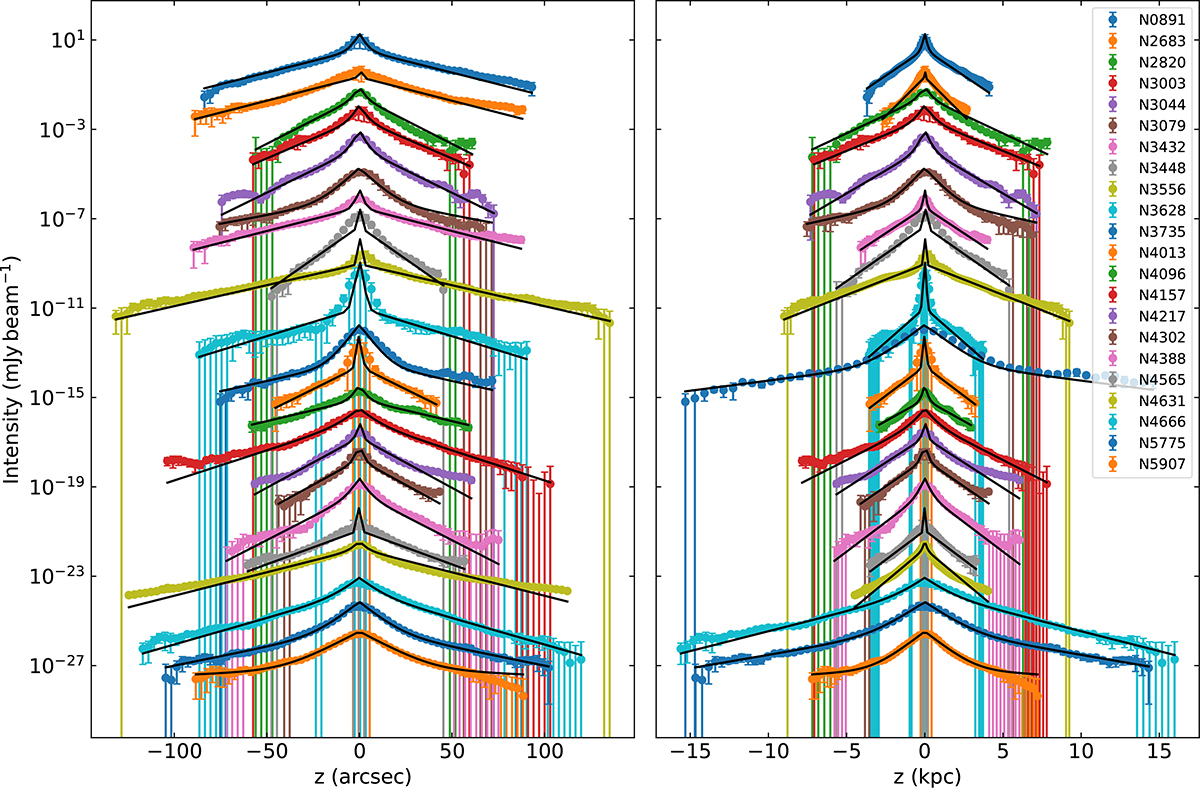
Vertical radio continuum intensity profiles at 3 GHz in our sample galaxies. We show the intensities in the central strip of each galaxy, with the exception of NGC 3079, 4388, and 4666 where those in the eastern strip are shown. The left panel shows them as observed on the sky, whereas the right panel shows them projected to the assumed distance. Solid lines show two-component exponential model profiles deconvolved from the effective beam. The intensities were arbitrarily scaled in order to separate the profiles for improved display.
Current usage metrics show cumulative count of Article Views (full-text article views including HTML views, PDF and ePub downloads, according to the available data) and Abstracts Views on Vision4Press platform.
Data correspond to usage on the plateform after 2015. The current usage metrics is available 48-96 hours after online publication and is updated daily on week days.
Initial download of the metrics may take a while.