Fig. 6.
Download original image
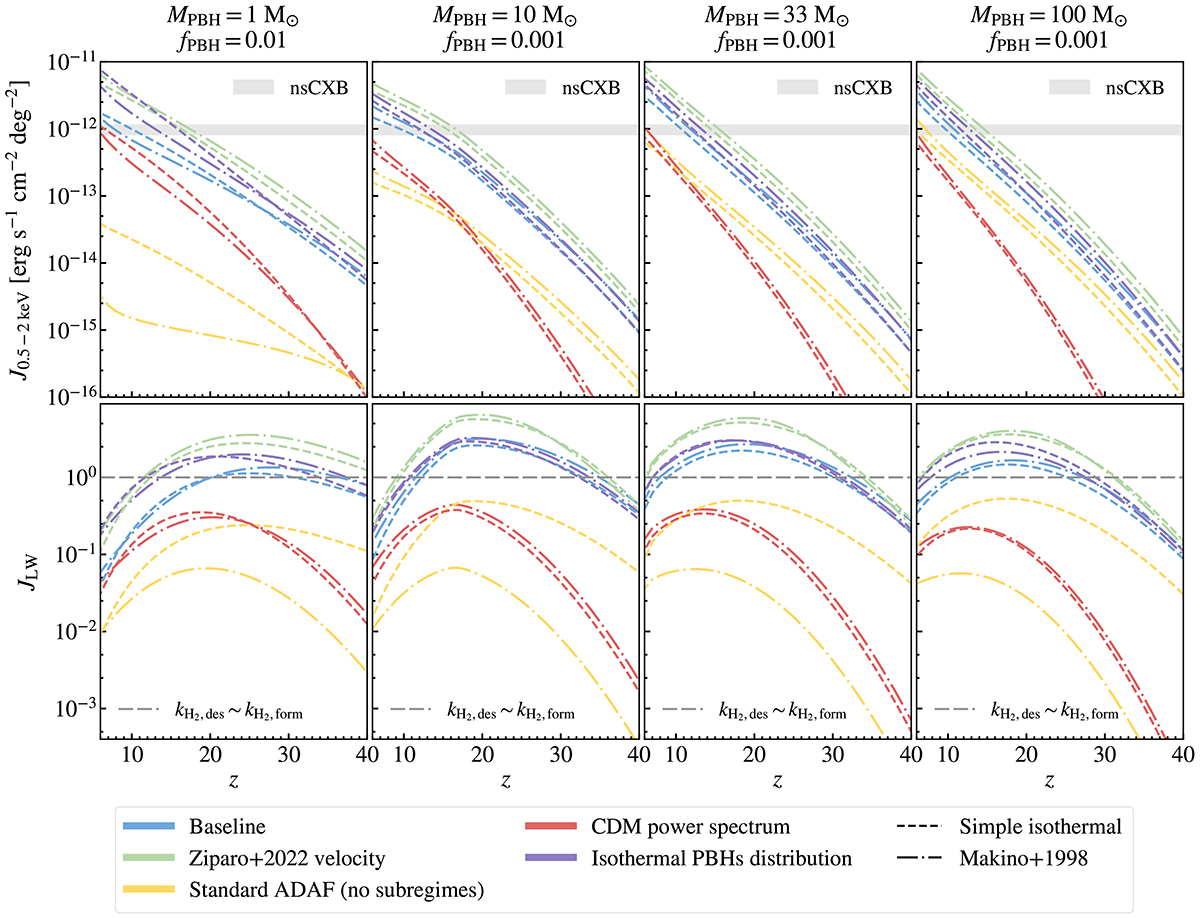
Cumulative soft X-ray and Lyman-Werner background intensities from PBHs accreting within halos under different model assumptions. Each column corresponds to a specific PBH mass (MPBH = 1 M⊙, 10 M⊙, 33 M⊙, and 100 M⊙) and the fPBH value derived from the baseline model where the observational (nsCXB) or theoretical (JLW ∼ 1) thresholds are exceeded. The top row shows the soft X-ray background intensity (J0.5 − 2 keV), while the bottom row displays the LW background intensity (JLW). The coloured lines represent different model variations: baseline model (blue), Ziparo+2022 velocity (green), standard ADAF without subregimes (yellow), CDM power spectrum (red), and isothermal PBH distribution (purple). Dashed and dashed-dotted lines correspond to results using the simple isothermal and Makino+1998 density profiles, respectively. The grey shaded region in the top row indicates the observed excess X-ray background from Cappelluti et al. (2017), and the dashed grey line in the bottom row marks the critical JLW ∼ 1, where molecular hydrogen dissociation balances its formation.
Current usage metrics show cumulative count of Article Views (full-text article views including HTML views, PDF and ePub downloads, according to the available data) and Abstracts Views on Vision4Press platform.
Data correspond to usage on the plateform after 2015. The current usage metrics is available 48-96 hours after online publication and is updated daily on week days.
Initial download of the metrics may take a while.