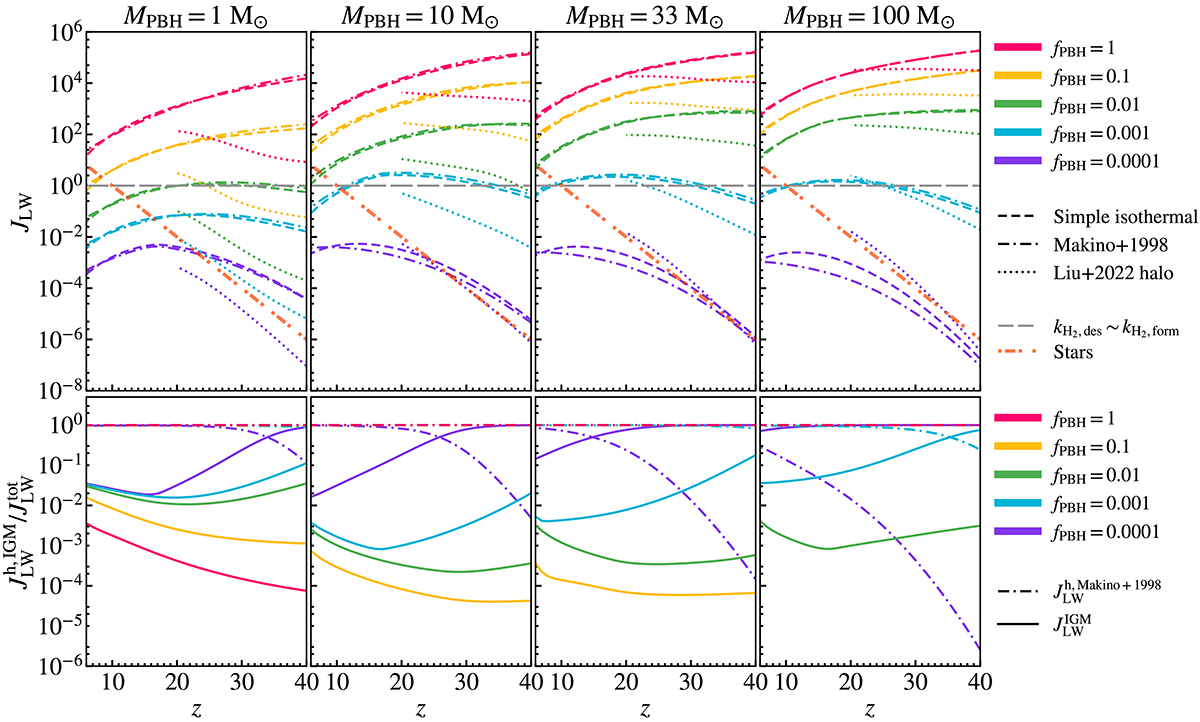
Fig. 4.
Download original image
Background intensity of LW radiation (JLW) produced by accreting high-z PBH sources. The format of panels, colours, and line styles is identical to Fig. 3: each column corresponds to a different PBH mass, colours represent fPBH values, and line styles denote the density profiles considered (simple isothermal, Makino+1998, and Liu+2022). The grey dashed line represents the critical value JLW ∼ 1, where the destruction rate of H2 equals the formation rate, while the orange dashed-dotted line shows the contribution from stellar sources for reference. The bottom row illustrates the relative contributions of halos (![]() ) and the IGM (
) and the IGM (![]() ) to the total LW background intensity (
) to the total LW background intensity (![]() ). These are represented as
). These are represented as ![]() (dashed-dotted lines) and
(dashed-dotted lines) and ![]() (solid lines), respectively. The relative contributions are computed using the same PBH masses and density profile configurations as in the top row. For fPBH > 0.0001, the halo contribution dominates at all redshifts, while for fPBH = 0.0001, the IGM contribution becomes significant at smaller redshifts, especially for larger PBH masses.
(solid lines), respectively. The relative contributions are computed using the same PBH masses and density profile configurations as in the top row. For fPBH > 0.0001, the halo contribution dominates at all redshifts, while for fPBH = 0.0001, the IGM contribution becomes significant at smaller redshifts, especially for larger PBH masses.
Current usage metrics show cumulative count of Article Views (full-text article views including HTML views, PDF and ePub downloads, according to the available data) and Abstracts Views on Vision4Press platform.
Data correspond to usage on the plateform after 2015. The current usage metrics is available 48-96 hours after online publication and is updated daily on week days.
Initial download of the metrics may take a while.