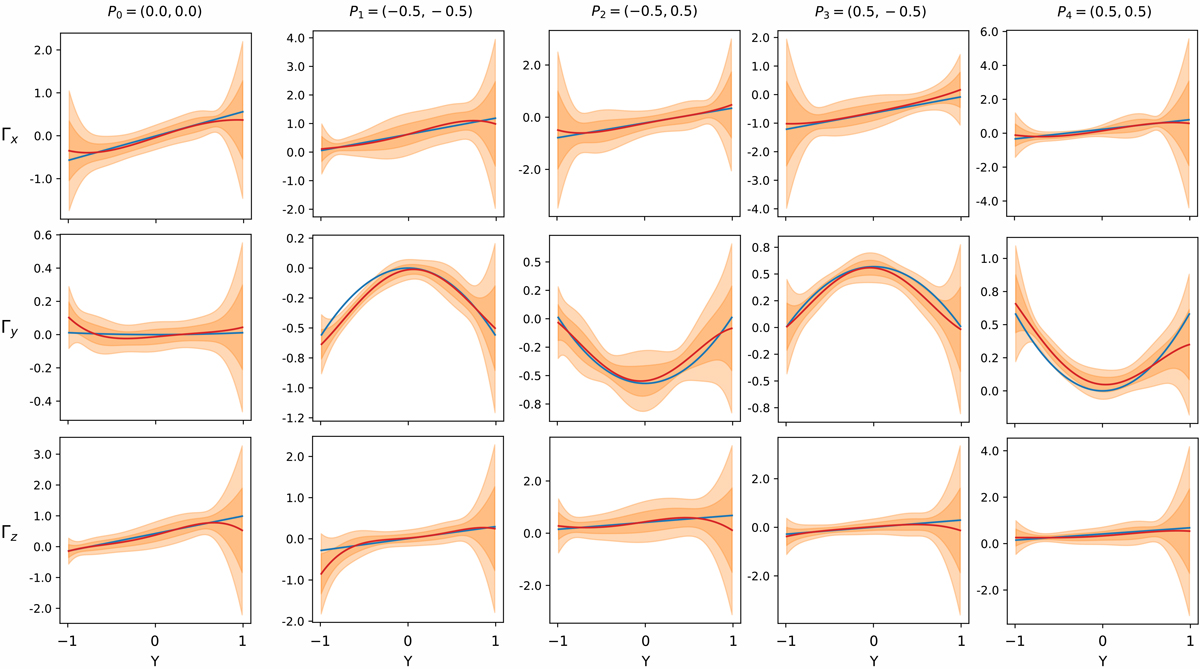
Fig. 6.
Download original image
Variation in the magnetic field vector components along the LOS. From top to bottom, we show the magnetic field vector component along the x, y, and z axes in the model, respectively. The different columns correspond to different positions in the FOV, whose location in normalized coordinates, Pi = (X, Z), is indicated to the left of each row. The blue curve shows the true magnetic field and the red curve the result of the inversion. The dark and light orange-shaded regions indicate the 68% and 95% confidence intervals of the inversion, respectively.
Current usage metrics show cumulative count of Article Views (full-text article views including HTML views, PDF and ePub downloads, according to the available data) and Abstracts Views on Vision4Press platform.
Data correspond to usage on the plateform after 2015. The current usage metrics is available 48-96 hours after online publication and is updated daily on week days.
Initial download of the metrics may take a while.