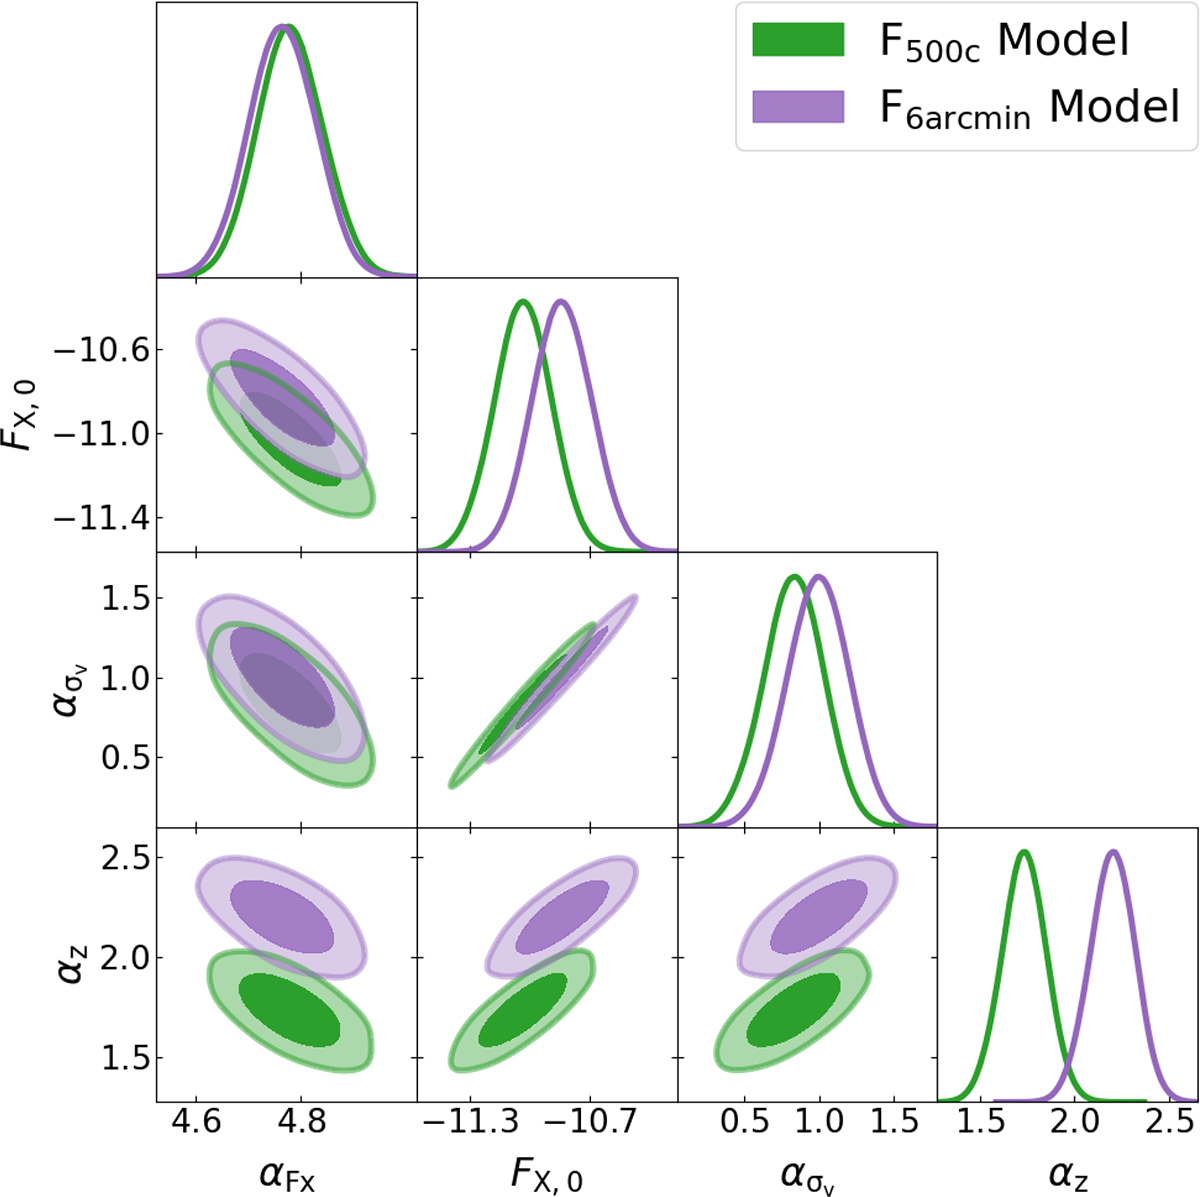
Fig. 9.
Download original image
Marginalised posterior distribution of the best-fit model of the X-ray plus optical selection function (see Eq. (15)). The filled 2D contours show the 1σ and 2σ confidence levels of the posteriors after convolution with the uniform priors. The green contours denote the base selection function where flux is measured within R500c, the violet contours show the effect of measuring flux within an angular aperture of six arcminutes. The parameter values are reported in Table 2.
Current usage metrics show cumulative count of Article Views (full-text article views including HTML views, PDF and ePub downloads, according to the available data) and Abstracts Views on Vision4Press platform.
Data correspond to usage on the plateform after 2015. The current usage metrics is available 48-96 hours after online publication and is updated daily on week days.
Initial download of the metrics may take a while.