Fig. 8.

Download original image
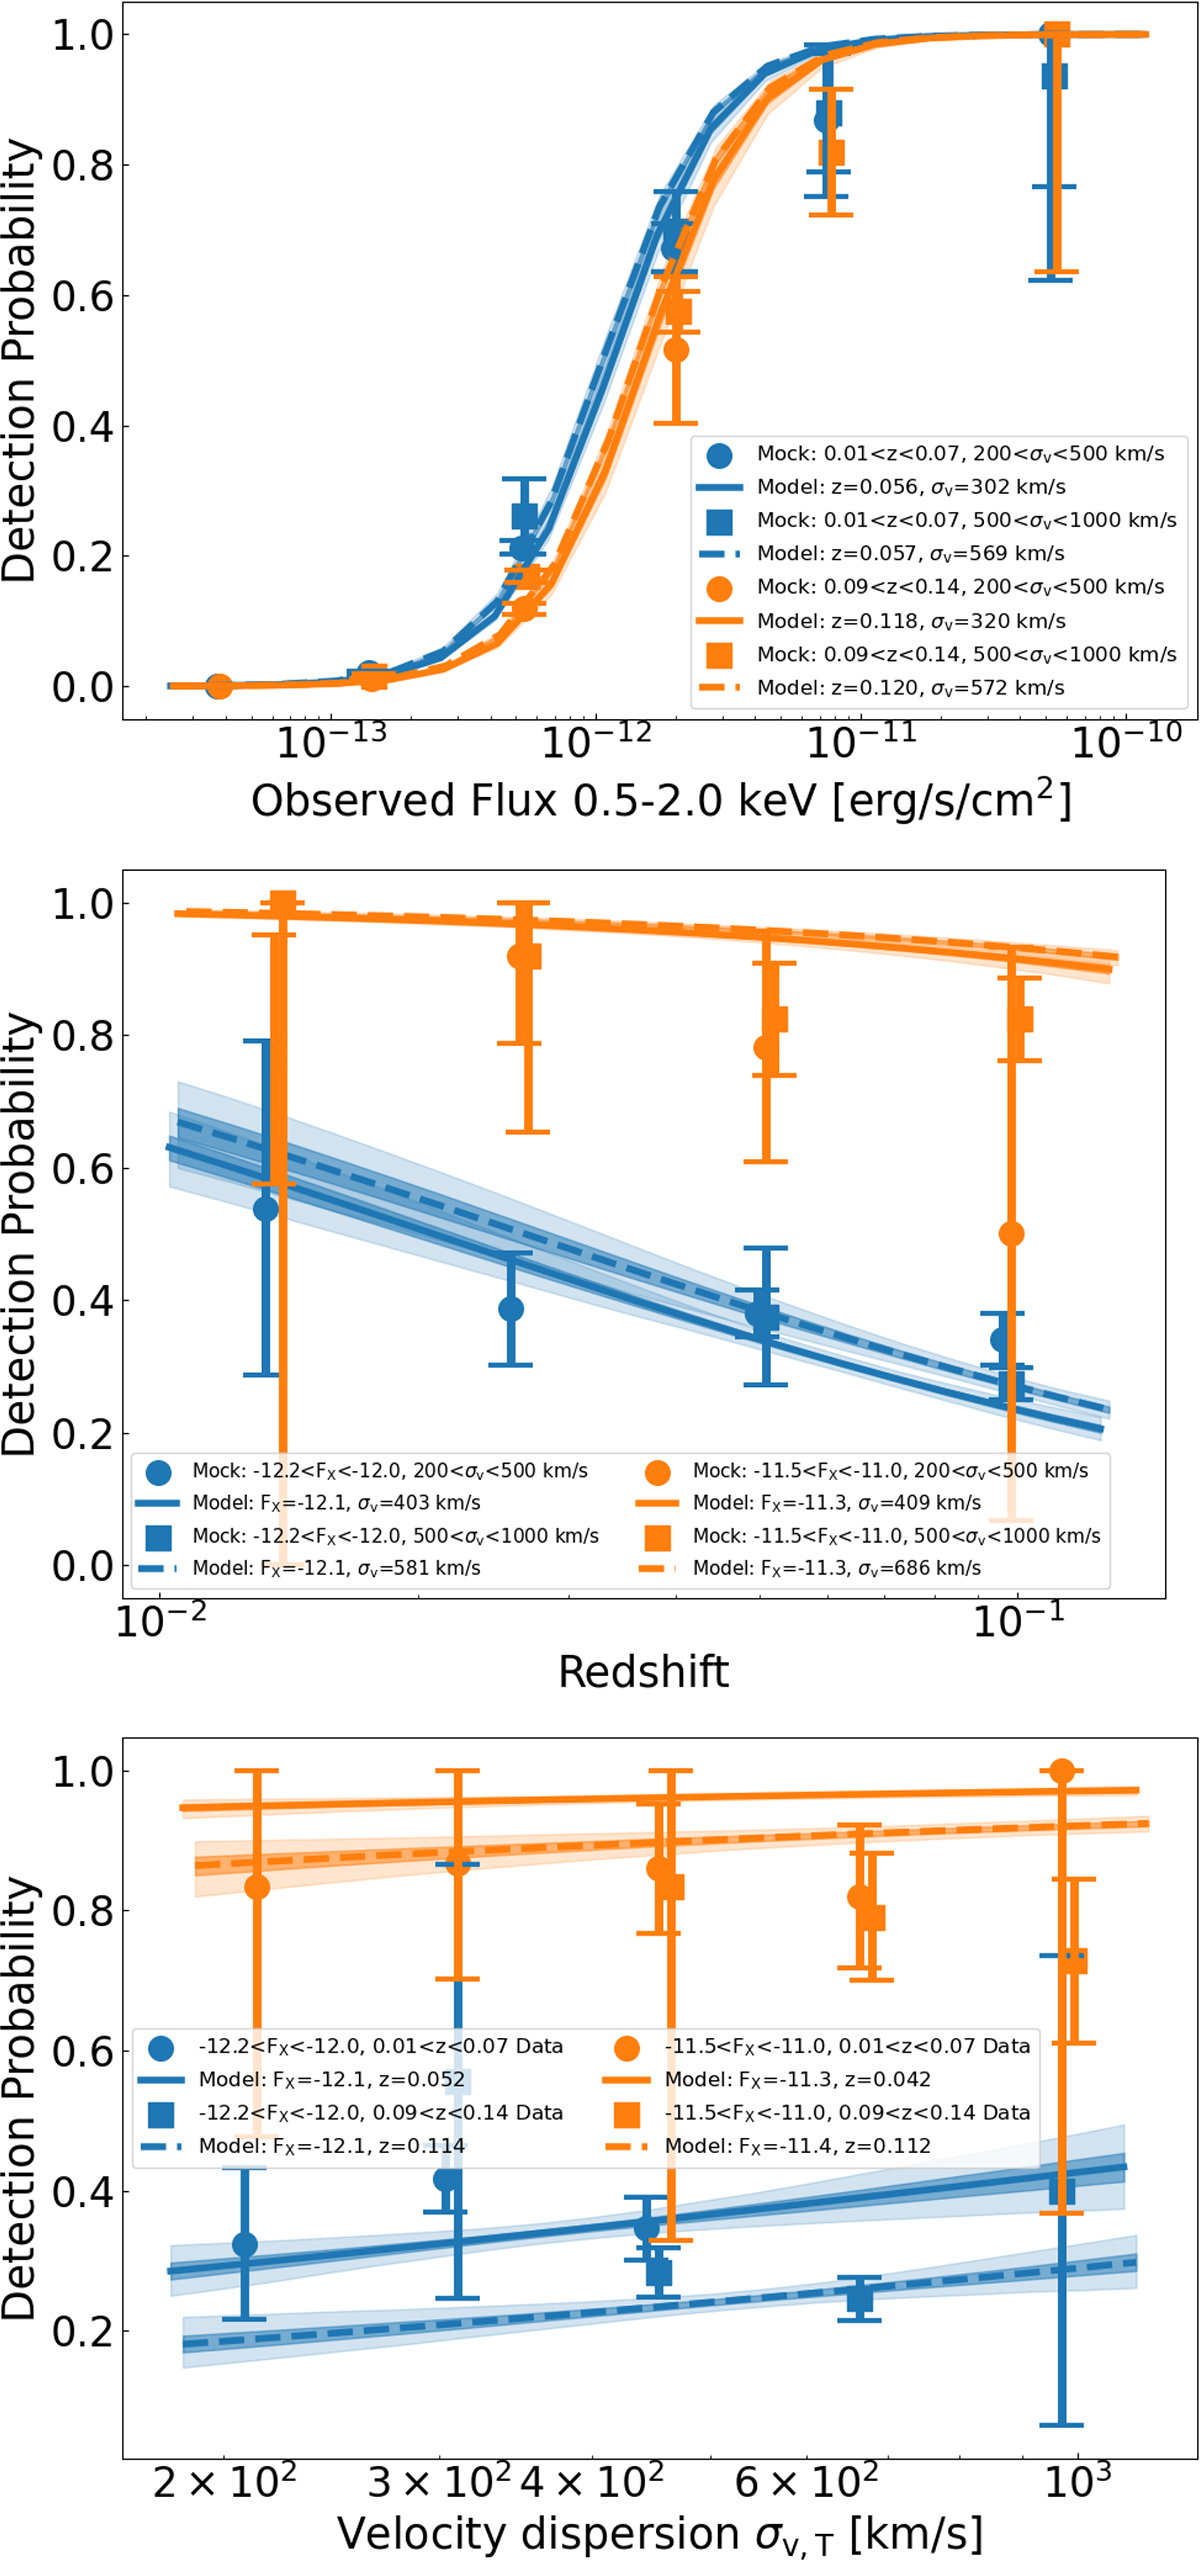
Probability of detection for X-GAP-selected haloes as a function of observables. The three panels show different combinations of flux measured within R500c, redshift, and velocity dispersion on the x-axis in different colours and with different symbols. The various line styles denote the selection function model in Eq. (15). The error bars account for the Poisson error on the number of total and detected sources. The lines in each panel were shifted by −0.02, −0.01, 0, and 0.01 dex for clarity.
Current usage metrics show cumulative count of Article Views (full-text article views including HTML views, PDF and ePub downloads, according to the available data) and Abstracts Views on Vision4Press platform.
Data correspond to usage on the plateform after 2015. The current usage metrics is available 48-96 hours after online publication and is updated daily on week days.
Initial download of the metrics may take a while.


