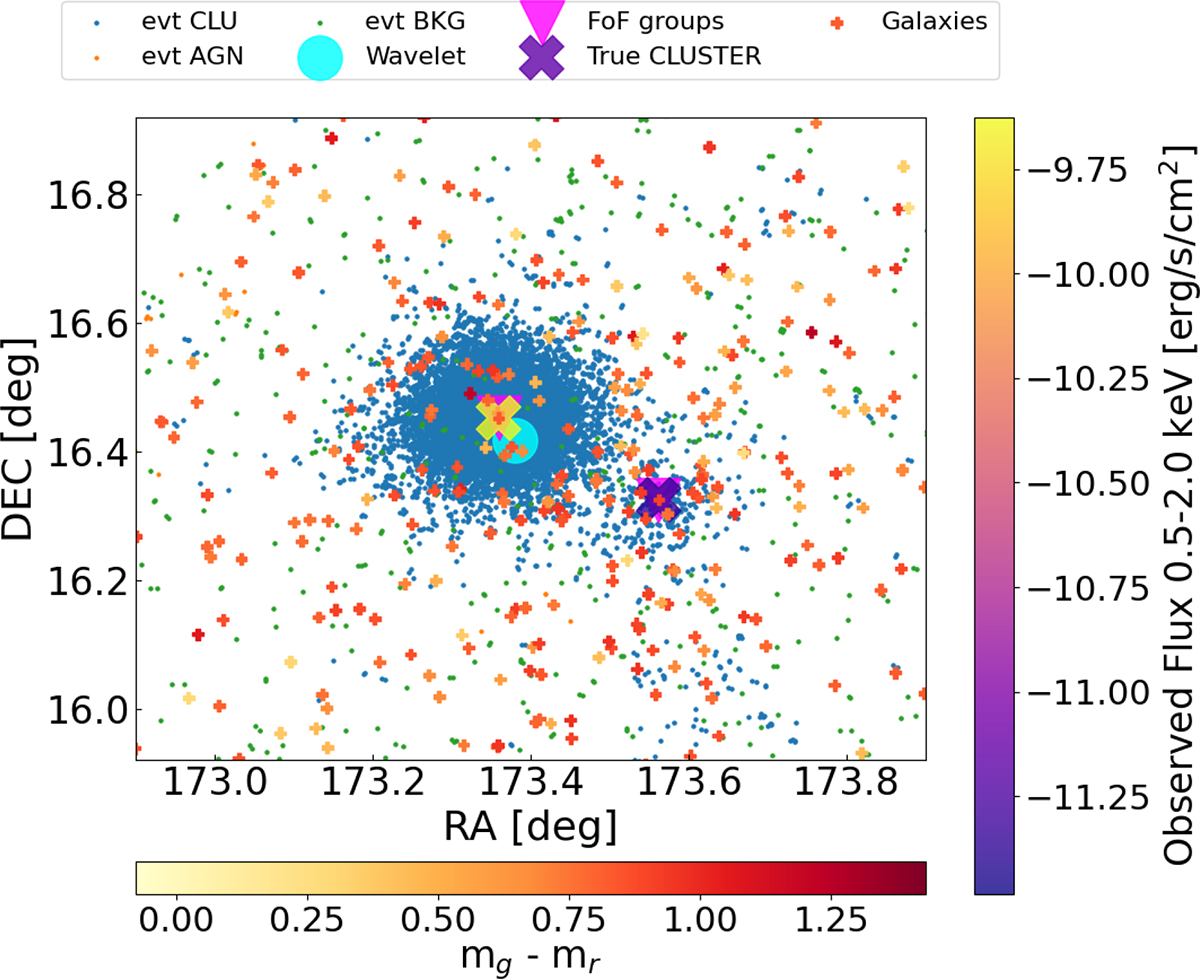
Fig. 5.
Download original image
Image example showing one of the brightest clusters in our mock with the additional components we included in the simulation. A secondary halo is located in the south-east region compared to the brightest one. The events generated by clusters (AGN, the X-ray background) are displayed as small dots in blue (orange, green). The true halo position is shown with large crosses, colour-coded by the X-ray flux. The position of the X-ray wavelet (optical FoF) detection is located at the cyan circle (magenta triangle). Each galaxy is marked by the small plus signs, according to their g-r colour. The vertical colour bar refers to input groups and clusters (the large crosses), the bottom one to individual galaxies (small plus signs).
Current usage metrics show cumulative count of Article Views (full-text article views including HTML views, PDF and ePub downloads, according to the available data) and Abstracts Views on Vision4Press platform.
Data correspond to usage on the plateform after 2015. The current usage metrics is available 48-96 hours after online publication and is updated daily on week days.
Initial download of the metrics may take a while.