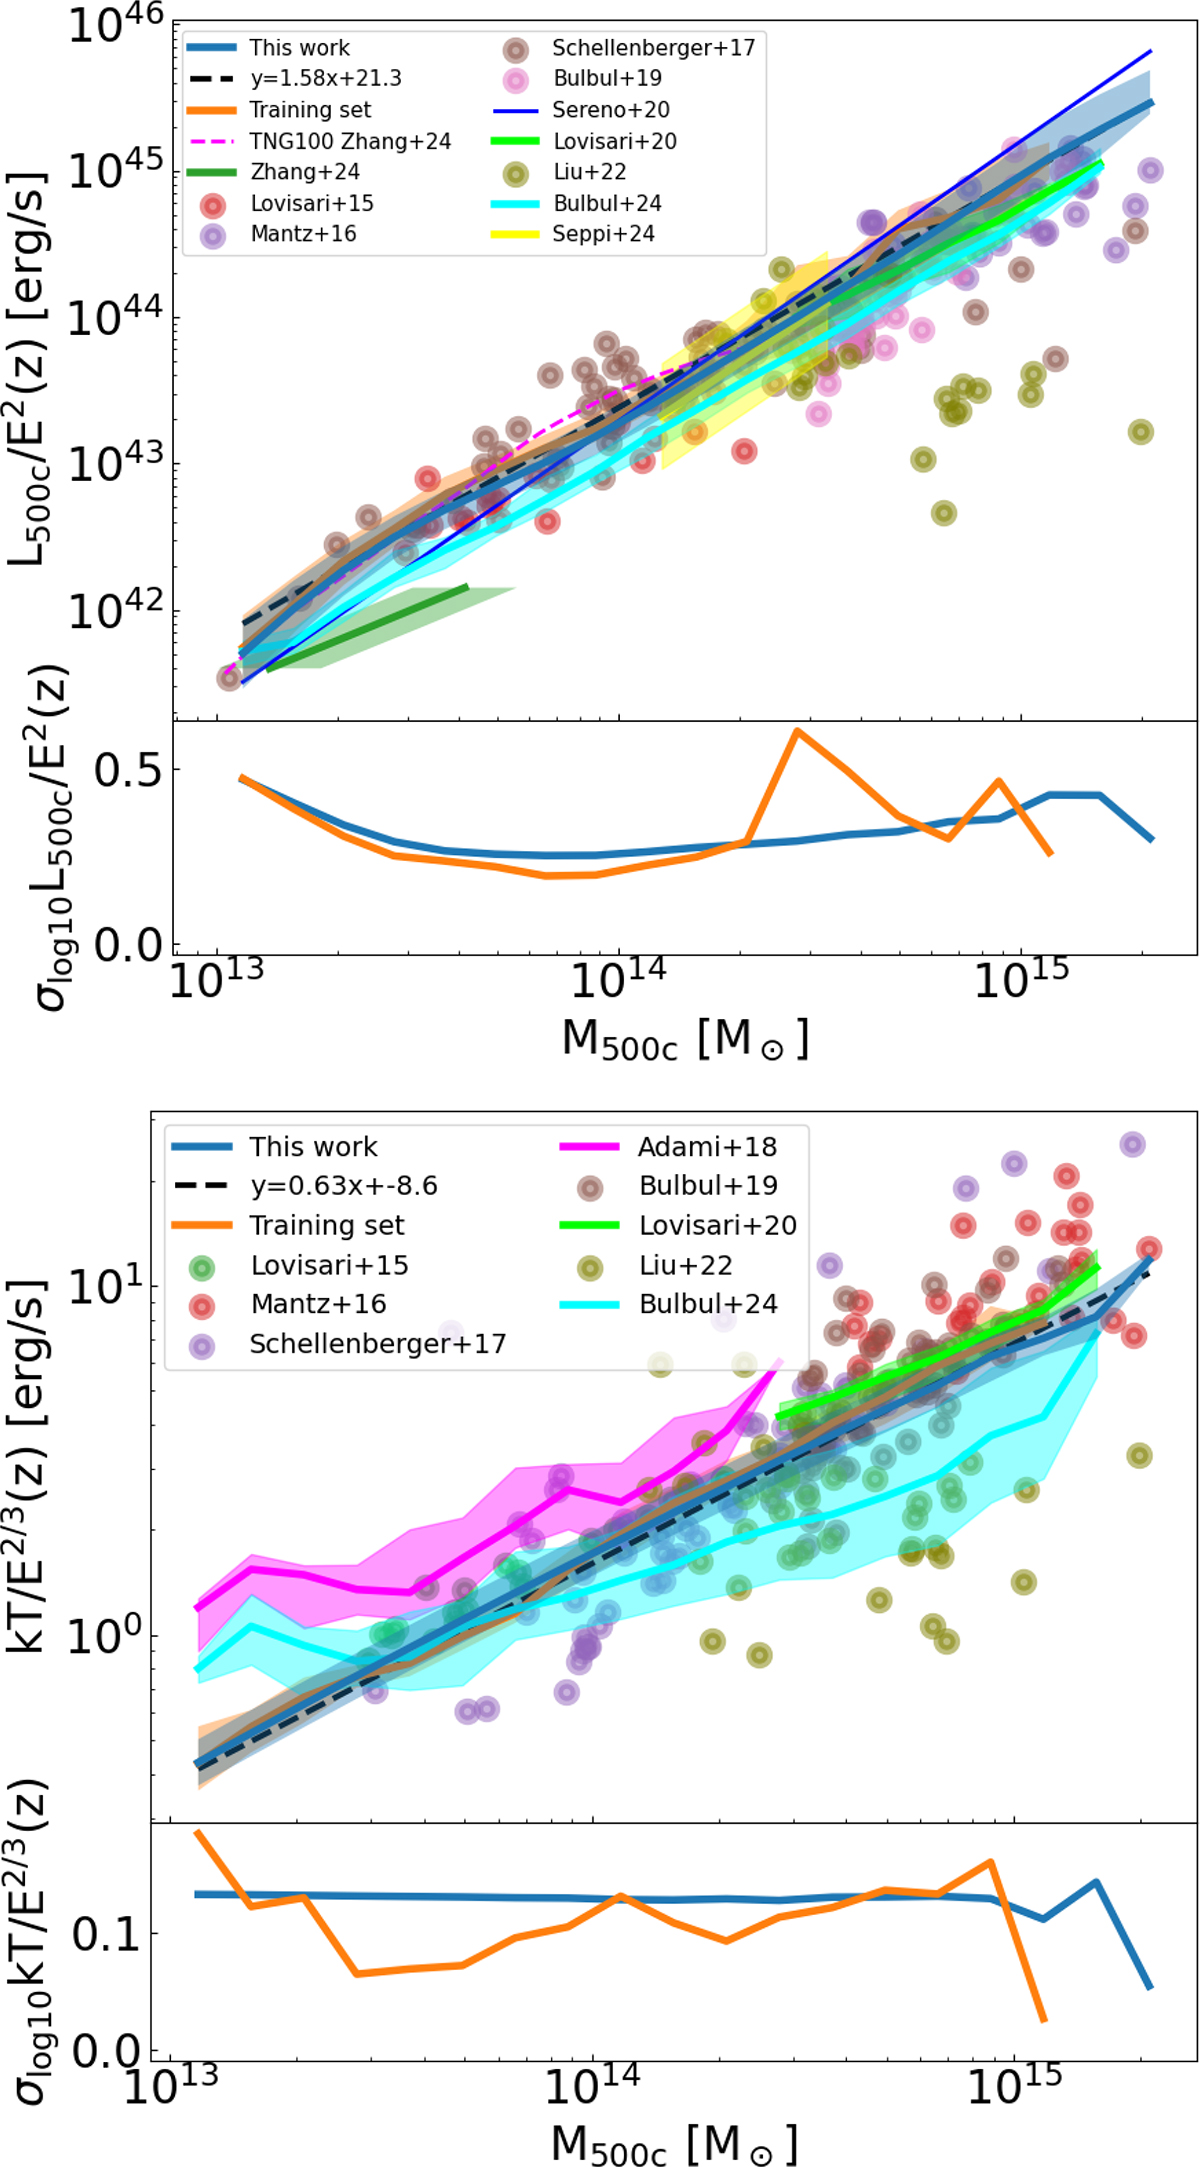
Fig. 4.
Download original image
X-ray scaling relation prediction of the cluster and group model. Top panel: Scaling relation between X-ray luminosity obtained by integrating the emission measure profiles (see Eq. (11)) and halo mass. Bottom panel: Scaling relation between temperature and halo mass. The blue shaded area shows the 16th–84th percentile distribution for the model applied to the Uchuu light cone in each mass bin. Our model is compared to a collection of real groups and cluster samples. The bottom part of both panels shows the intrinsic scatter evolution as a function of halo mass.
Current usage metrics show cumulative count of Article Views (full-text article views including HTML views, PDF and ePub downloads, according to the available data) and Abstracts Views on Vision4Press platform.
Data correspond to usage on the plateform after 2015. The current usage metrics is available 48-96 hours after online publication and is updated daily on week days.
Initial download of the metrics may take a while.