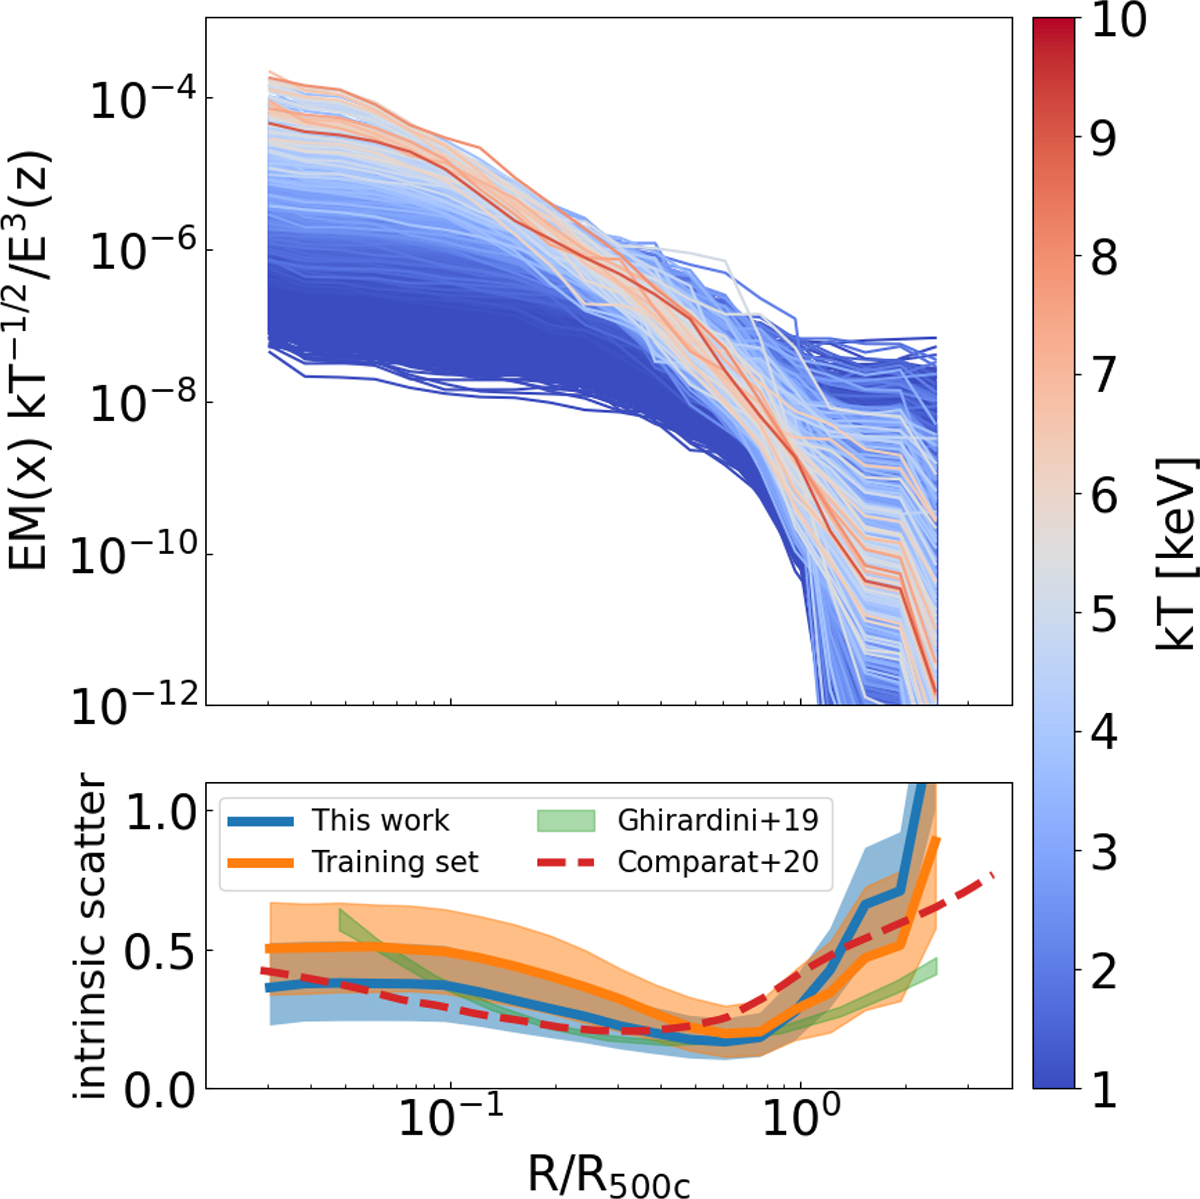
Fig. 3.
Download original image
Emission measure profiles with self-similar scaling, colour-coded for temperature, as a function of radius in units of R500c. The units on the y-axis are Mpc keV−1/2 cm−6. The bottom part of the panel shows the evolution of the intrinsic scatter of the profile at different radii. For reference, it is compared to the model from Comparat et al. (2020) and profiles of X-COP clusters (Ghirardini et al. 2019).
Current usage metrics show cumulative count of Article Views (full-text article views including HTML views, PDF and ePub downloads, according to the available data) and Abstracts Views on Vision4Press platform.
Data correspond to usage on the plateform after 2015. The current usage metrics is available 48-96 hours after online publication and is updated daily on week days.
Initial download of the metrics may take a while.