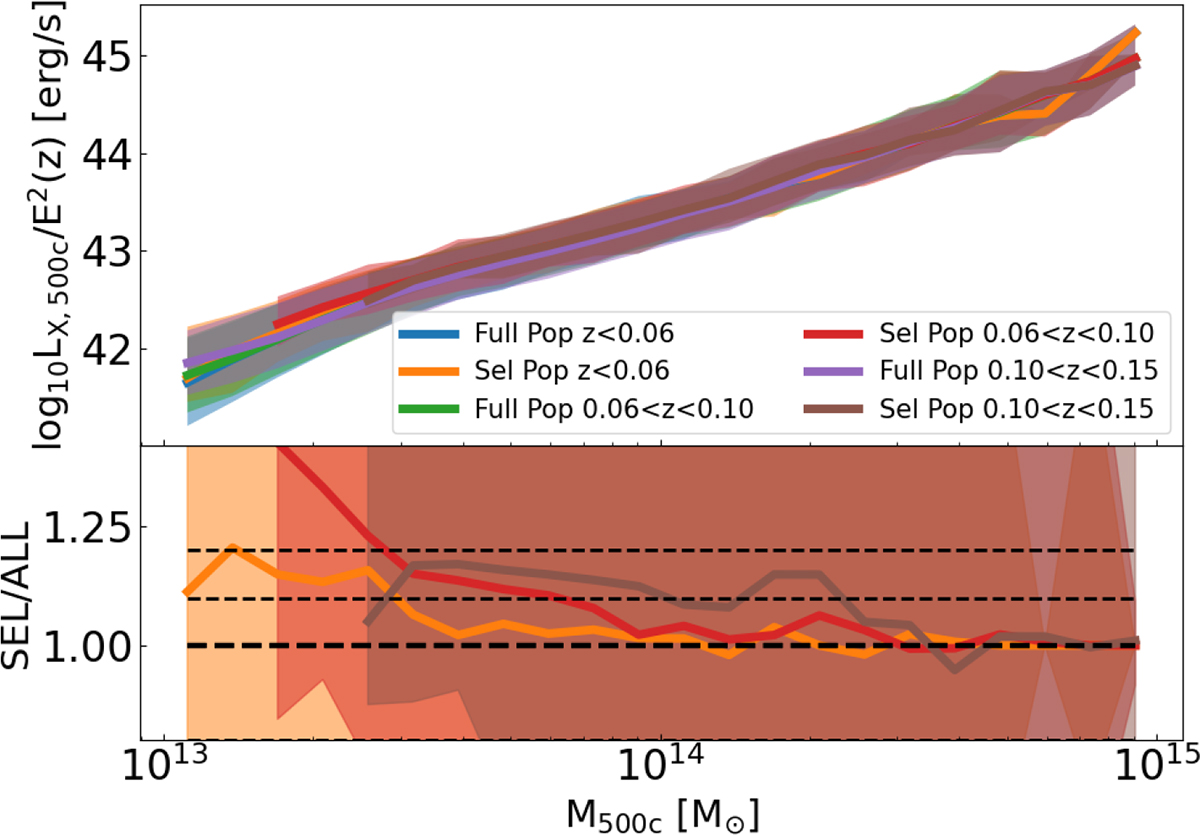
Fig. C.2.
Download original image
Scaling relation between X-ray luminosity and halo mass, as in the top panel of Fig. C.1, but split in different redshift bins. The panel shows the comparison between full population in the light cone and the one selected from our detection scheme. Different colours denote various redshift intervals: below 0.06 (in blue and orange), then up to 0.1 (in green and red), and 0.15 (in purple and brown).
Current usage metrics show cumulative count of Article Views (full-text article views including HTML views, PDF and ePub downloads, according to the available data) and Abstracts Views on Vision4Press platform.
Data correspond to usage on the plateform after 2015. The current usage metrics is available 48-96 hours after online publication and is updated daily on week days.
Initial download of the metrics may take a while.