Fig. 12.
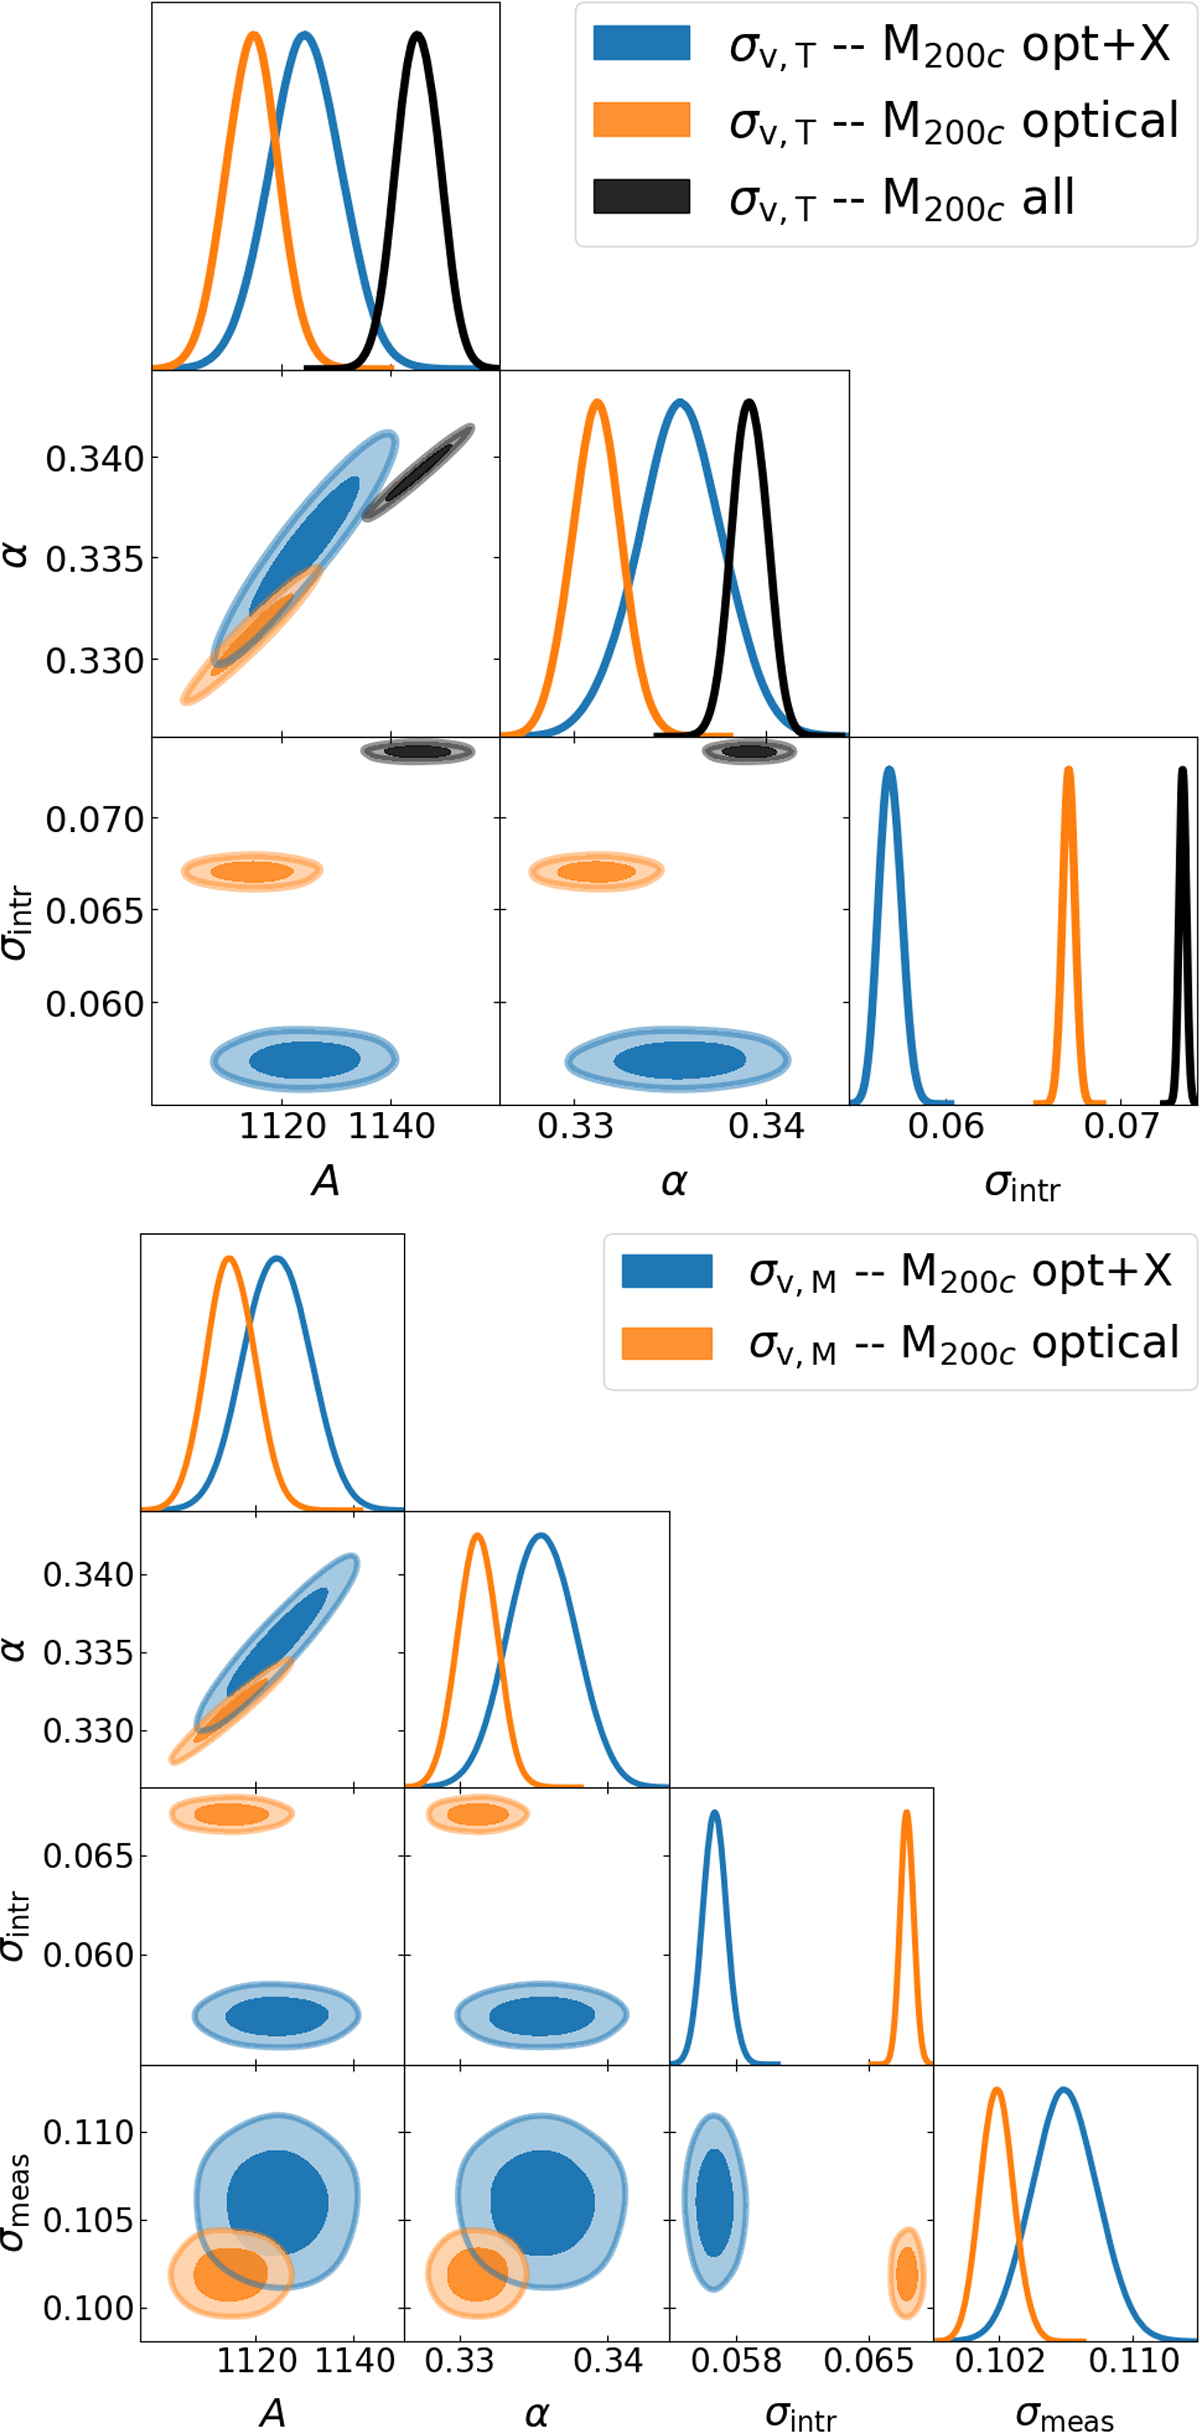
Download original image
Marginalised posterior distributions of the best-fit scaling relation parameters between velocity dispersion and M200c. The filled 2D contours show the 1-σ and 2-σ confidence levels of the posteriors after convolution with the uniform priors. The model is given by Eq. (17). The corresponding 1D parameter constraints are reported in Table 3. The top panel refers to direct relation between true velocity dispersion and halo mass, with black contours referring to the full sample, orange ones to clusters and groups detected in the optical mock, and blue ones with the addition of the X-ray detection. The bottom panel refers to the full model of the scaling relation accounting for the measured velocity dispersion.
Current usage metrics show cumulative count of Article Views (full-text article views including HTML views, PDF and ePub downloads, according to the available data) and Abstracts Views on Vision4Press platform.
Data correspond to usage on the plateform after 2015. The current usage metrics is available 48-96 hours after online publication and is updated daily on week days.
Initial download of the metrics may take a while.