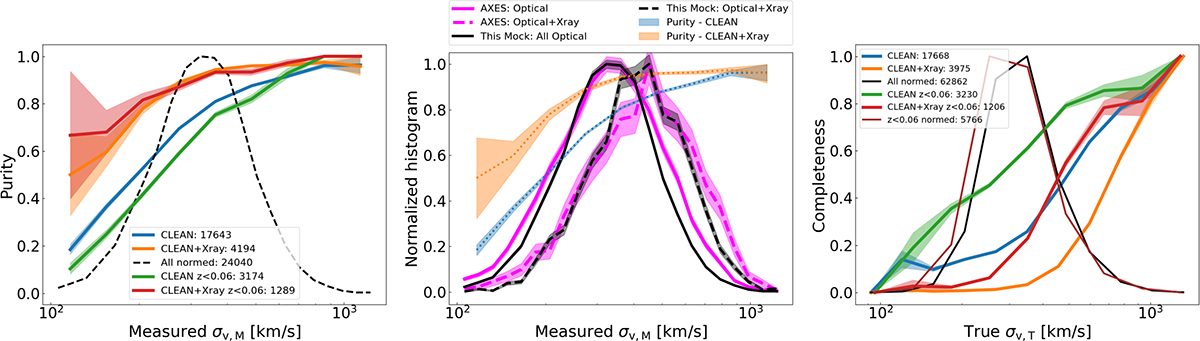
Fig. 10.
Download original image
Trade-off between completeness and purity as a function of velocity dispersion. Left panel: Fraction of objects with a corresponding real input dark matter halo as a function of measured velocity dispersion. The blue line shows the fraction of objects detected in the optical mock that are matched to a real halo in the light cone. The orange line denotes objects with a corresponding X-ray detection. The green and red lines refer to the low redshift population, in the interval of interest for X-GAP, between 0.02 and 0.06. The black line shows the normalised distribution of measured velocity dispersion in the simulation. Central panel: Distribution of the measured velocity dispersion in our mock and in the real data. The blue and orange lines are left as a reference from the previous panel. The pink lines show the normalised distributions of the real AXES sample from Damsted et al. (2024), while the black ones refer to the simulation. The solid (dashed) lines denote the full optical (optical plus X-ray) detections. Right panel: Fraction of real input dark matter haloes with a corresponding detection in the mock. The coloured lines represent the same populations as the top panel, but starting from the true input dark matter haloes.
Current usage metrics show cumulative count of Article Views (full-text article views including HTML views, PDF and ePub downloads, according to the available data) and Abstracts Views on Vision4Press platform.
Data correspond to usage on the plateform after 2015. The current usage metrics is available 48-96 hours after online publication and is updated daily on week days.
Initial download of the metrics may take a while.