Open Access
Fig. 11
Download original image
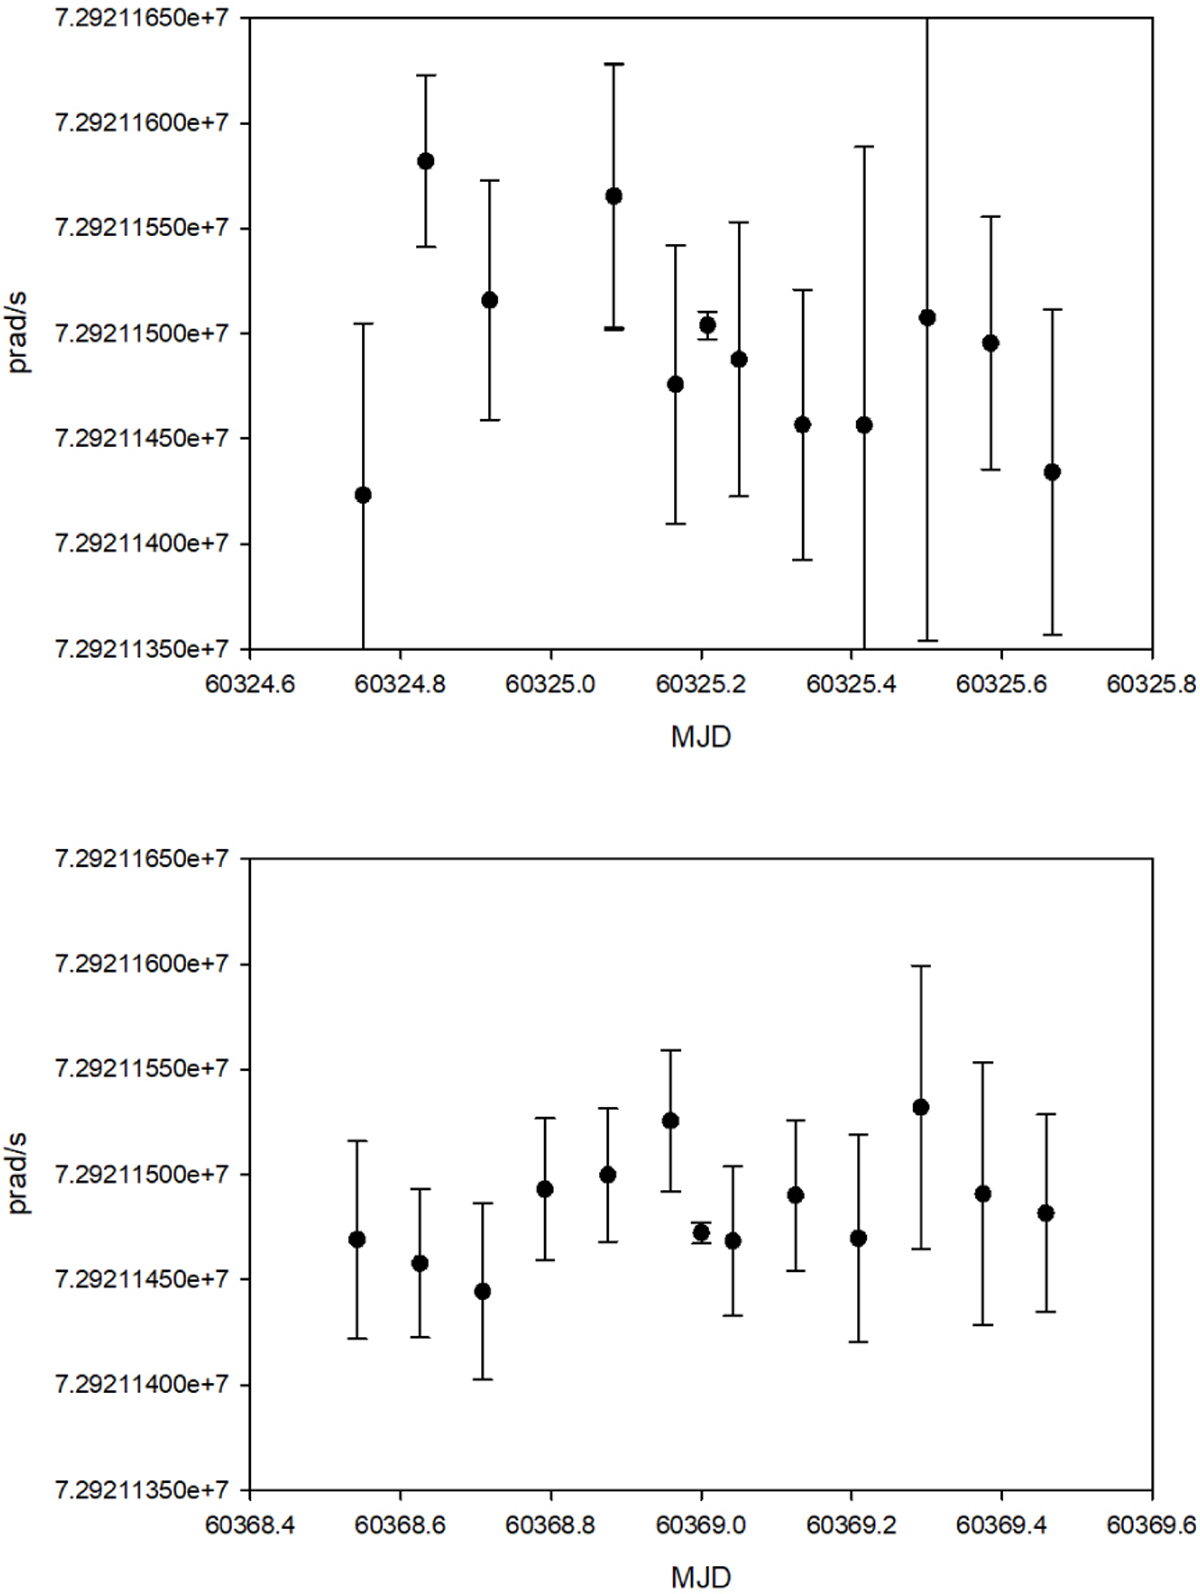
Time series of vector Ω estimates with 2-hour resolution. Top panel: data from the IVS-R1 experiment R1138 on 15 January, 2024. Bottom panel: data from the VGOS experiment VO-4059 on 28 February, 2024. Daily estimates of the vector Ω are shown in the middle of each graph and are identified by the smaller formal errors.
Current usage metrics show cumulative count of Article Views (full-text article views including HTML views, PDF and ePub downloads, according to the available data) and Abstracts Views on Vision4Press platform.
Data correspond to usage on the plateform after 2015. The current usage metrics is available 48-96 hours after online publication and is updated daily on week days.
Initial download of the metrics may take a while.