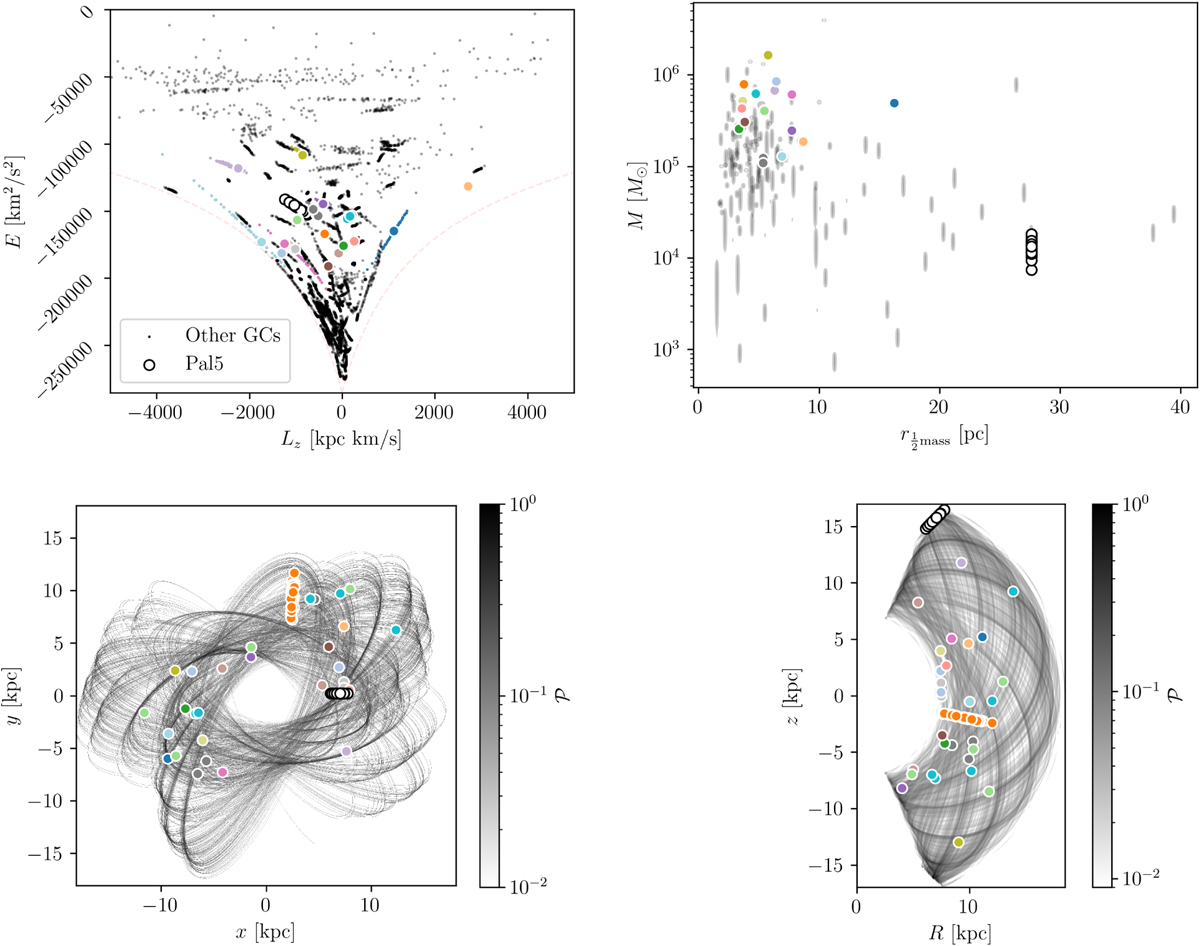
Fig. 7
Download original image
Top left: energy-angular momentum space of the globular clusters in the simulations, with 50 × 165 data points representing all sampled initial conditions. Clusters impacting Palomar 5 are shown with colored markers, large for the samplings that induce a gap and small for those that do not. The small gray dots represent the non-gap-causing clusters. The 50 white dots indicate Palomar 5’s sampled initial conditions for the current day position. The light-pink dashed curve shows the circular velocity curve. Top right: mass-size plane of the globular clusters in the simulations, with uncertainties on the masses indicated as vertical lines. We remind the reader that the globular cluster catalog currently does not provide uncertainties for the characteristic radii of clusters. Bottom left: Palomar 5’s orbit in the Galactocentric xy plane. The gray scale represents all 50 stacked orbits, with 𝒫 indicating the probability of Palomar 5’s position, normalized to 𝒫max = 1. The colored markers indicate the position of the perturber when it impacted the stream and not its present-day position. Bottom right: same as the bottom left but in the meridional plane. In all panels, the colors of the markers and histogram bars correspond to specific perturbers as specified in Fig. 3.
Current usage metrics show cumulative count of Article Views (full-text article views including HTML views, PDF and ePub downloads, according to the available data) and Abstracts Views on Vision4Press platform.
Data correspond to usage on the plateform after 2015. The current usage metrics is available 48-96 hours after online publication and is updated daily on week days.
Initial download of the metrics may take a while.