Fig. 6
Download original image
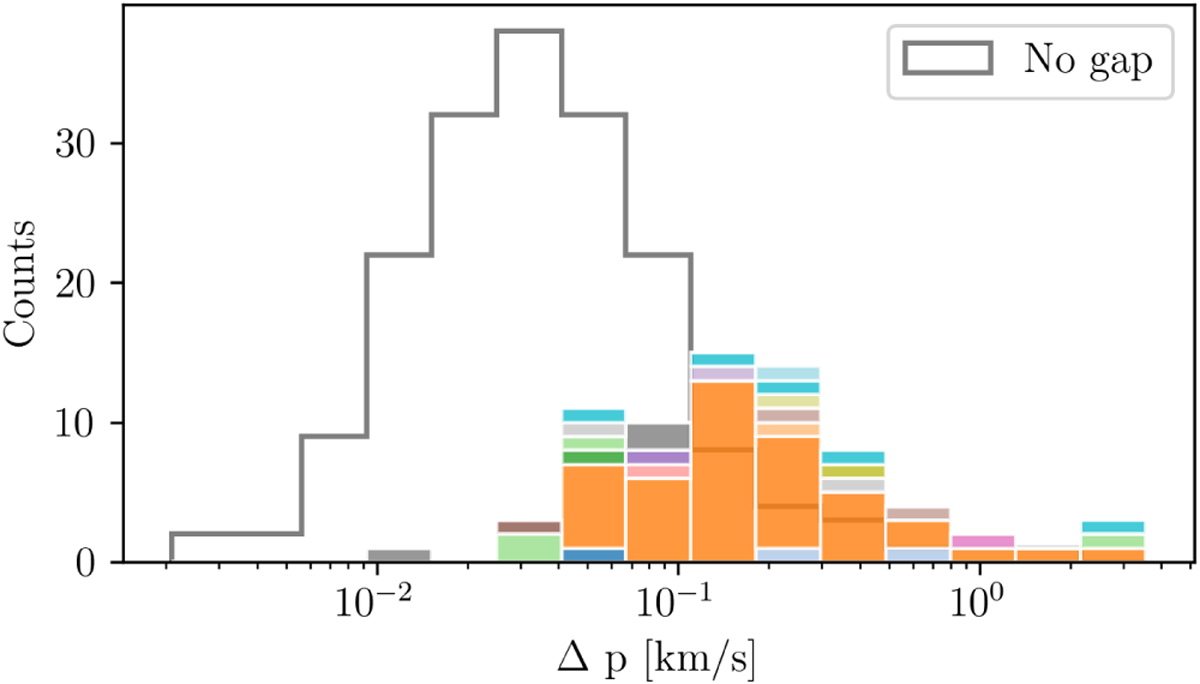
Distribution of imparted change in momentum (per unit mass) from a cluster flyby given by Eq. (6). The data set includes the top 5 strongest flybys from each simulation. Those that cause gaps are colored, stacked, and overlaid atop those that do not – this is the gray distribution. We note the meaning of the colors is the same as in Fig. 3.
Current usage metrics show cumulative count of Article Views (full-text article views including HTML views, PDF and ePub downloads, according to the available data) and Abstracts Views on Vision4Press platform.
Data correspond to usage on the plateform after 2015. The current usage metrics is available 48-96 hours after online publication and is updated daily on week days.
Initial download of the metrics may take a while.