Fig. 5
Download original image
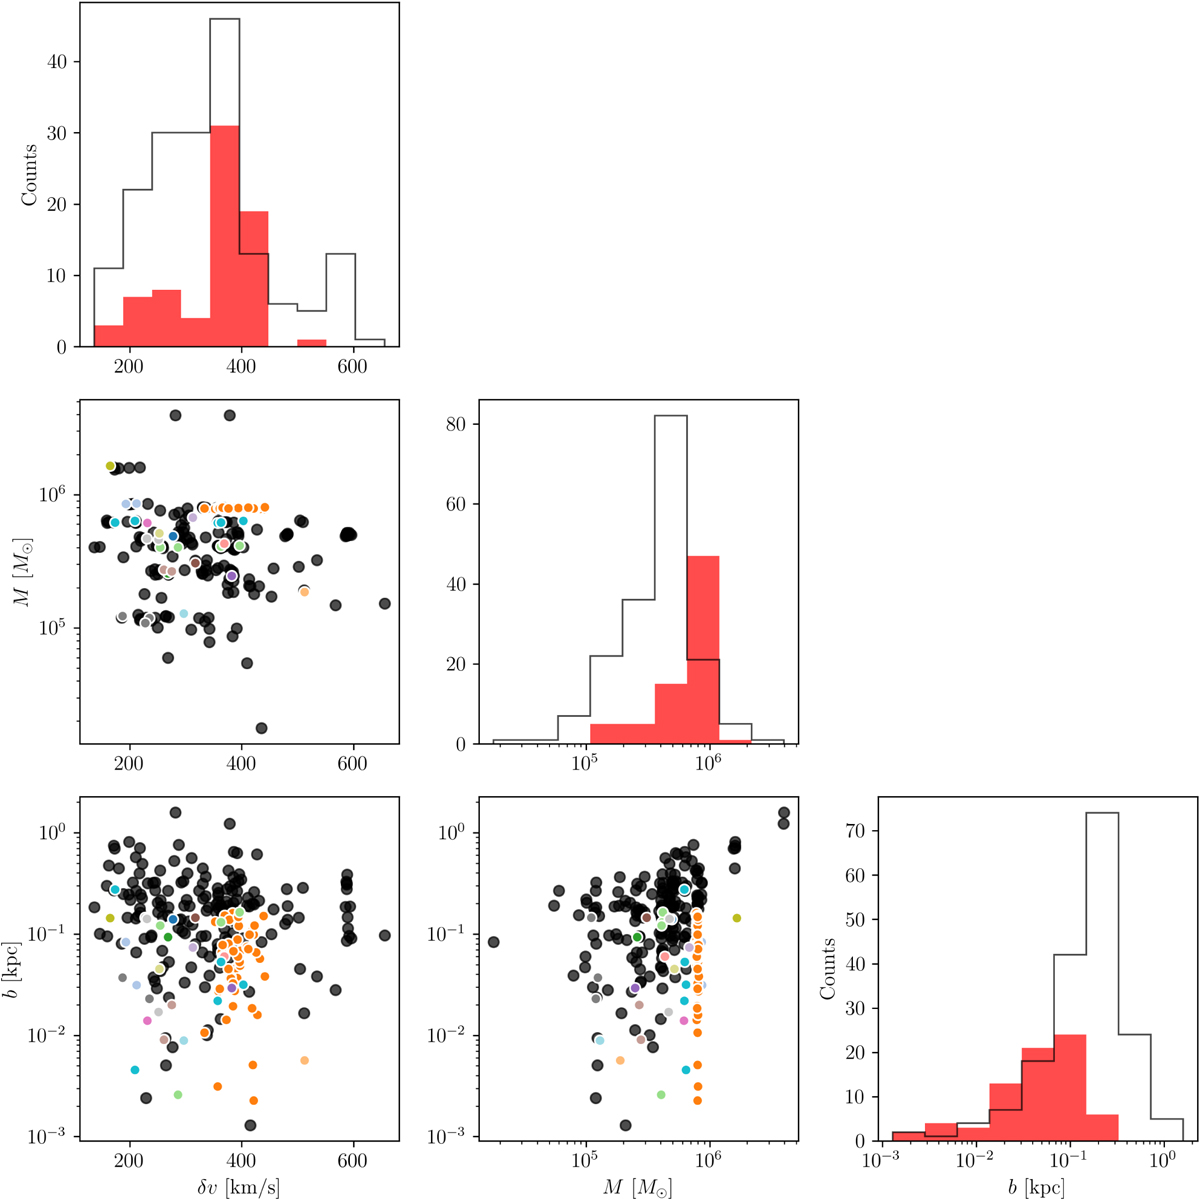
Distribution and relationship between the impact variables from Eq. (6) for all close flybys considered. The colors indicate the encounters that cause gaps and are the same as Fig. 3, with white edges for visibility and binned in red for the histograms. The black histogram shows the close encounters that did not lead to gaps. Indeed, no obvious trend has emerged that delimits these planes into gap-producing or non-gap-producing ones.
Current usage metrics show cumulative count of Article Views (full-text article views including HTML views, PDF and ePub downloads, according to the available data) and Abstracts Views on Vision4Press platform.
Data correspond to usage on the plateform after 2015. The current usage metrics is available 48-96 hours after online publication and is updated daily on week days.
Initial download of the metrics may take a while.