Fig. 3
Download original image
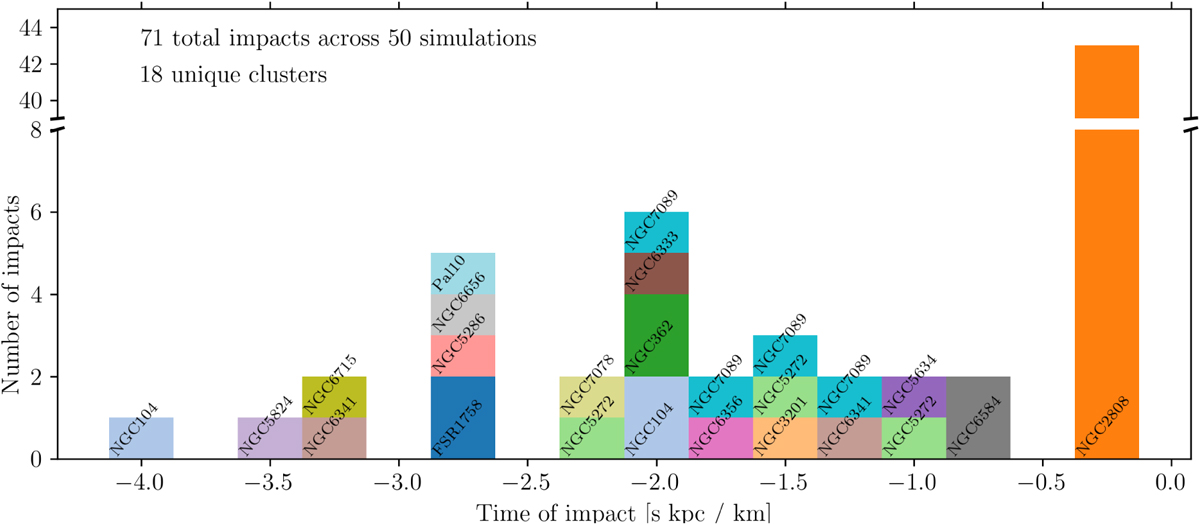
Simulation time when the impacts occurred for all gap-causing flybys summed over all 50 simulations. Each perturbing cluster is labeled and color-consistent. We report the time axis in simulation units, with 1 s kpc km −1 corresponding to roughly 1 Gyr. We note that the plot breaks the y-axis to accommodate the large number of encounters from NGC 2808 without overshadowing the other interactions.
Current usage metrics show cumulative count of Article Views (full-text article views including HTML views, PDF and ePub downloads, according to the available data) and Abstracts Views on Vision4Press platform.
Data correspond to usage on the plateform after 2015. The current usage metrics is available 48-96 hours after online publication and is updated daily on week days.
Initial download of the metrics may take a while.