Fig. 2
Download original image
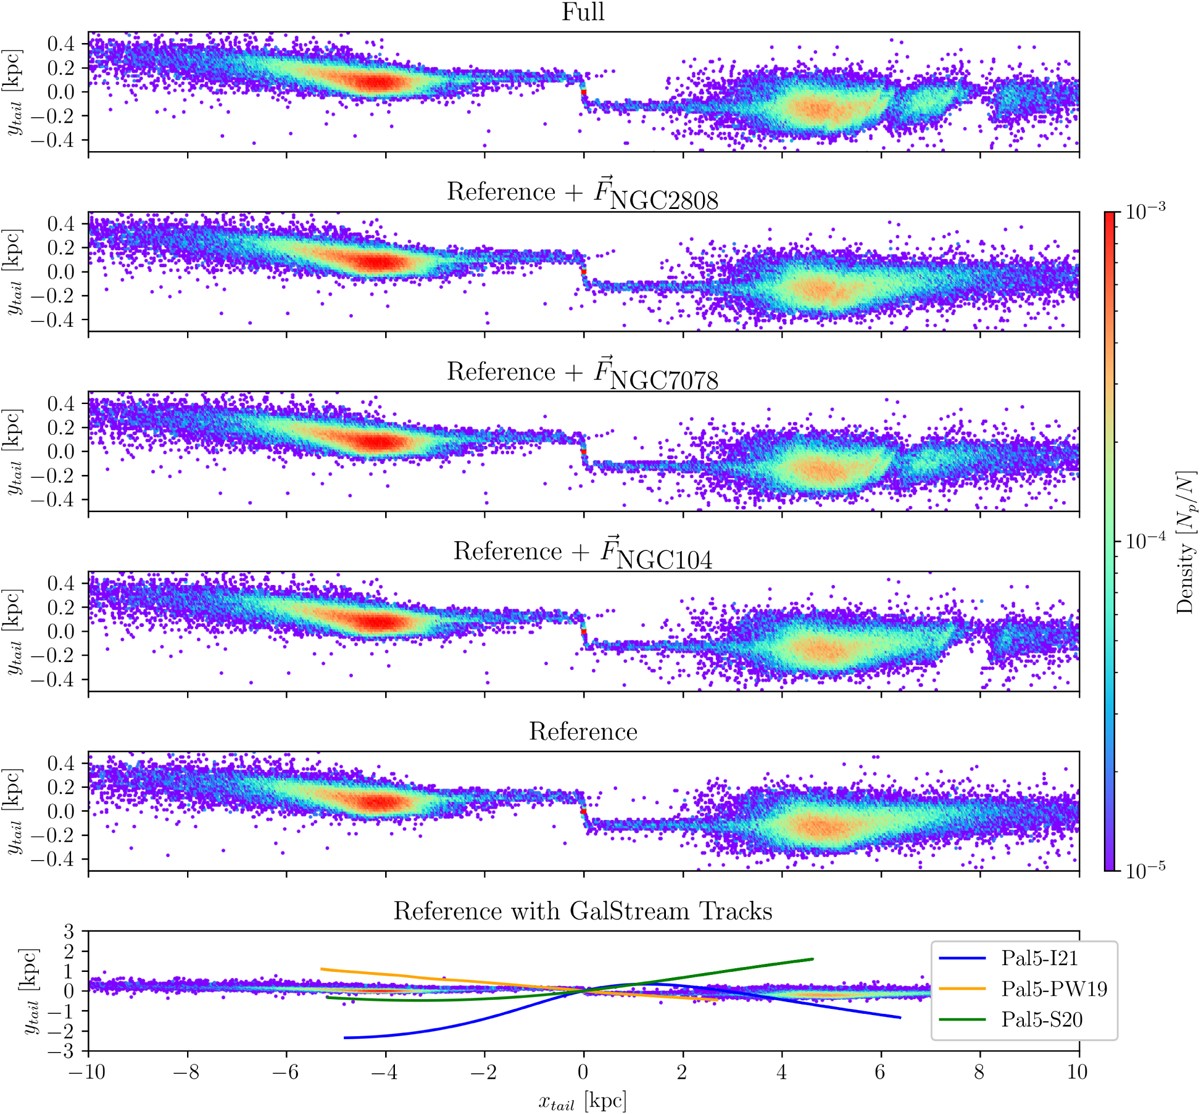
Density maps of Palomar 5’s stream in the tail coordinate system, where x′is the integrated arc length along the cluster’s orbit and y′ is the distance within the orbital plane. The color scale represents normalized particle counts (total: 100 000). The top panel shows the full simulation with three gaps on the stream’s right-hand side. The next three panels depict simulations with identical initial conditions but exclude the gravitational influence of all clusters except those forming a given gap. The Reference simulation omits the influence from other globular clusters. The bottom panel compares Palomar 5’s observed stream length to the Reference simulation, using the same Monte-Carlo realization as Fig. 1 and Sampling 009 (as seen in the online appendix).
Current usage metrics show cumulative count of Article Views (full-text article views including HTML views, PDF and ePub downloads, according to the available data) and Abstracts Views on Vision4Press platform.
Data correspond to usage on the plateform after 2015. The current usage metrics is available 48-96 hours after online publication and is updated daily on week days.
Initial download of the metrics may take a while.