Fig. D.1
Download original image
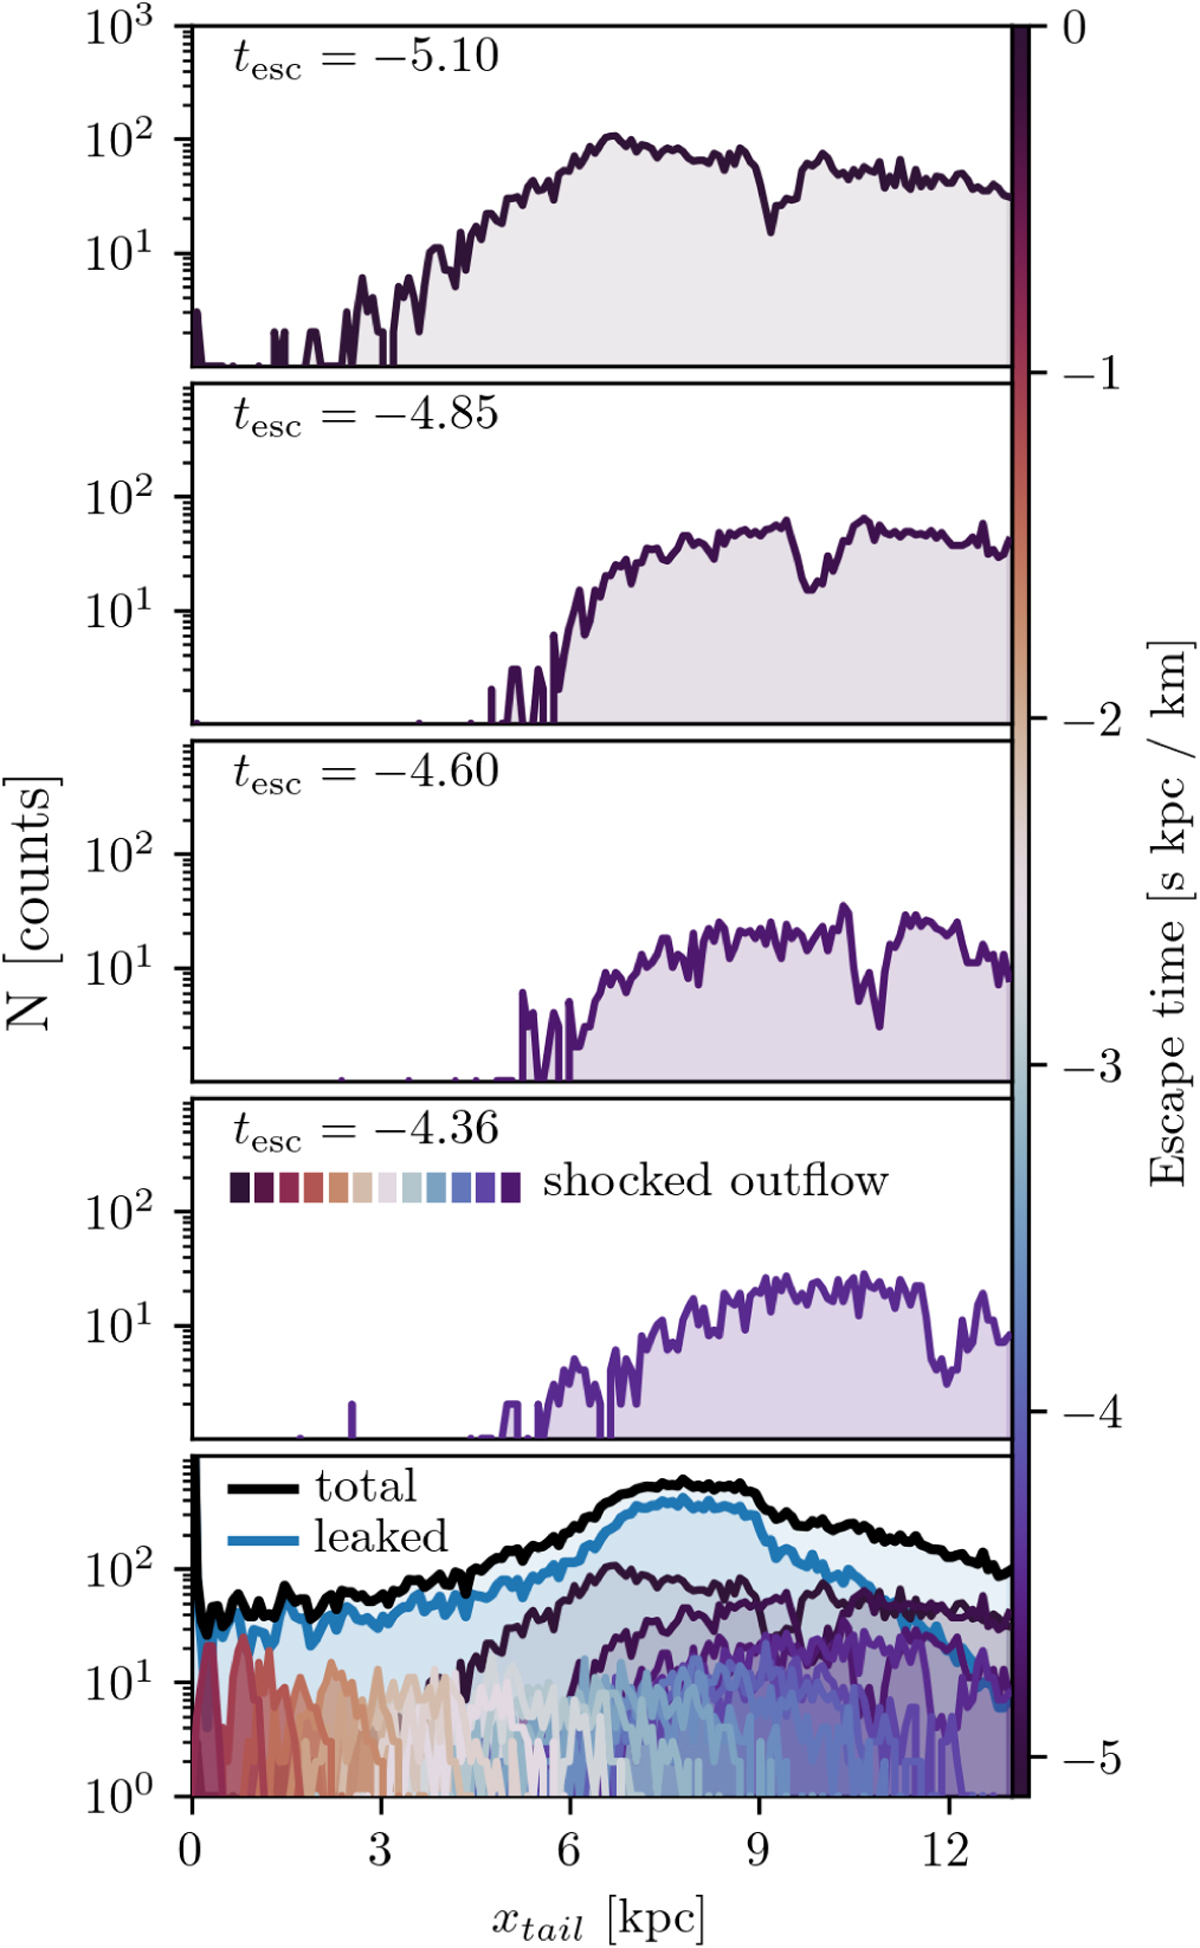
We dissect the one-dimensional density of the stream from the bottom panel of Fig. D.2. We divide the stars into two categories: the multiple groups that are shocked out at different pericenter passages, or those that leak out of the cluster continuously. The bottom panel shows the leaked population in blue, and each group that was shocked out at each pericenter passage is color-coded by the escape time. The sum of the leaked and shocked outflow gives the total profile density, which is shown in black. The top four panels display the first shocked groups from different pericenter passages, shown individually. Each group shows the gap resulting from the impact of NGC 7078 ∼2.5 Gyr ago, yet they are progressively offset as explained in the text.
Current usage metrics show cumulative count of Article Views (full-text article views including HTML views, PDF and ePub downloads, according to the available data) and Abstracts Views on Vision4Press platform.
Data correspond to usage on the plateform after 2015. The current usage metrics is available 48-96 hours after online publication and is updated daily on week days.
Initial download of the metrics may take a while.