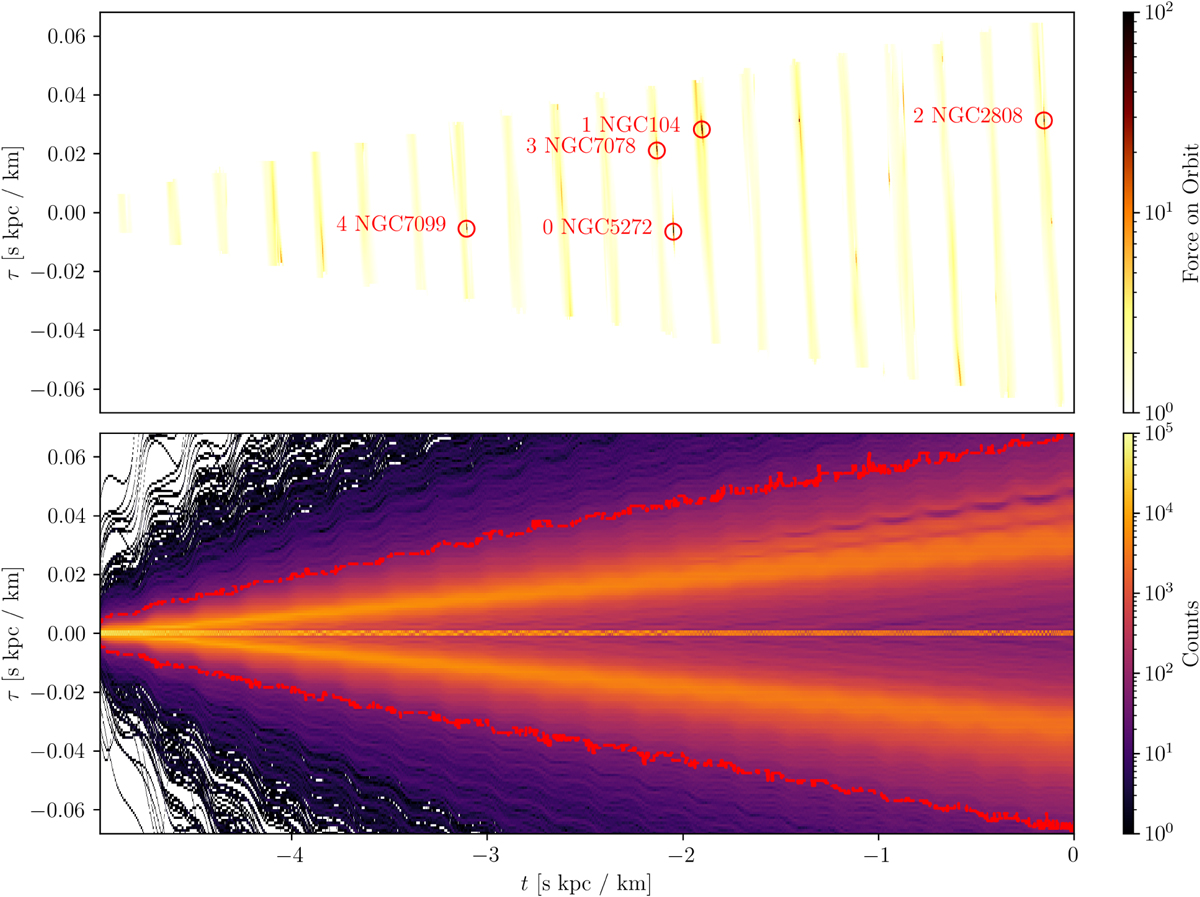
Fig. B.1
Download original image
Demonstration of how we determined which globular clusters were responsible for the gaps. The y-axis is τ, a coordinate in units of time that indicates how far ahead or behind it is from a globular cluster. The x-axis is the simulation time, t, where 0 s km kpc−1 indicates the present time. The bottom plot showcases the evolution of the stream density over simulation time. We used the density to determine a suitable stream length. Subsequently, we used this length to extract a piece of Palomar 5’s orbit. This orbital segment approximates the stream. Then, we compute the gravitational force from all other stream stand-in clusters, shown in the top plot. The gravitational force is measured in acceleration and is given in integration units: km2 kpc−1 s−2. Moments of high acceleration indicate the passage of another cluster. The red circles indicate the top 5 strongest passages, as well as the names of the clusters. The example shown in this plot is the same simulation as Fig. 1.
Current usage metrics show cumulative count of Article Views (full-text article views including HTML views, PDF and ePub downloads, according to the available data) and Abstracts Views on Vision4Press platform.
Data correspond to usage on the plateform after 2015. The current usage metrics is available 48-96 hours after online publication and is updated daily on week days.
Initial download of the metrics may take a while.