Fig. A.2
Download original image
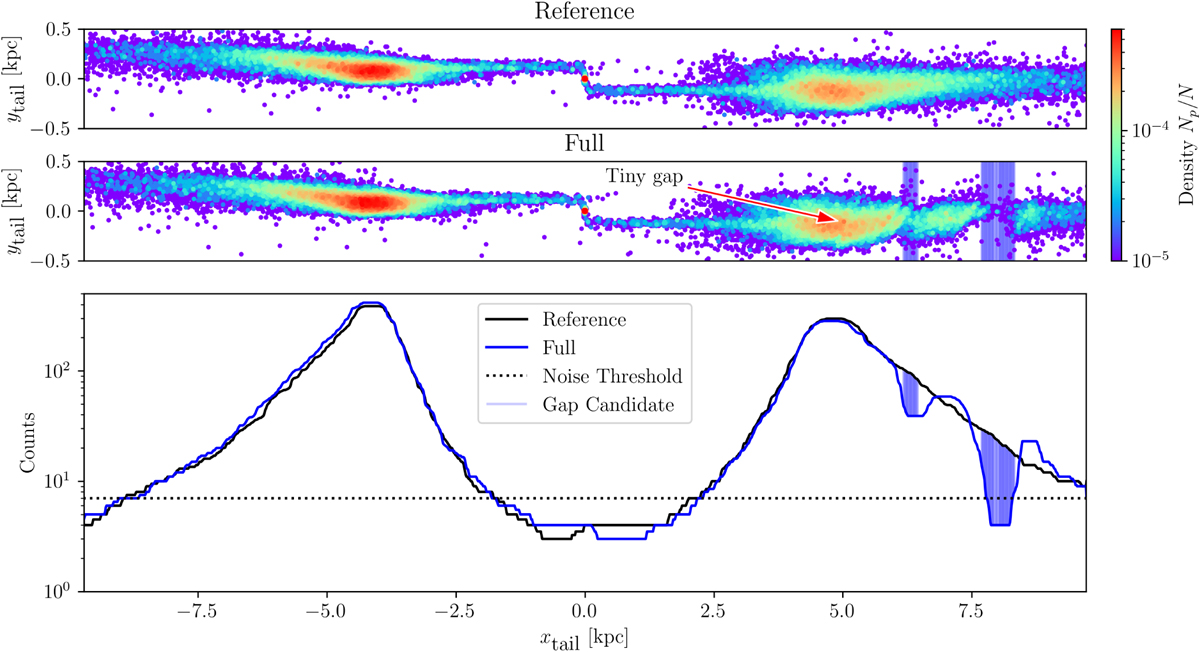
Comparison between the density maps and profiles of the full and reference simulations is presented. The blue vertical bars highlight the locations where the full simulation is less dense than the reference simulation by 2-σ. We do not consider bins below the noise threshold when measuring the differences between the two 1D profiles. We smoothed the 1D profiles with a median box-car filter.
Current usage metrics show cumulative count of Article Views (full-text article views including HTML views, PDF and ePub downloads, according to the available data) and Abstracts Views on Vision4Press platform.
Data correspond to usage on the plateform after 2015. The current usage metrics is available 48-96 hours after online publication and is updated daily on week days.
Initial download of the metrics may take a while.