Fig. 1
Download original image
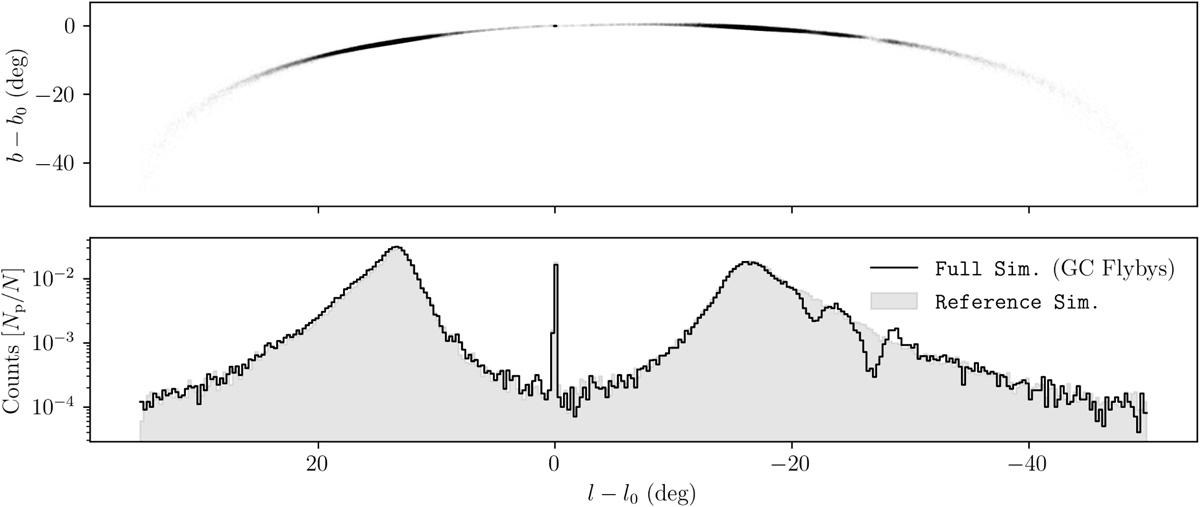
Simulated Palomar 5 stream created by modeling the host cluster as a Plummer sphere disrupting within an axis-symmetric Galactic potential plus the gravitational effect of 164 other Galactic globular clusters. The top panel shows the distribution of star particles that escaped the cluster due to tidal forces. The bottom panel shows the 1D density profile marginalized over longitude. The gray fill shows a reference simulation that uses the same conditions to produce the stream but does not include the other globular clusters. The large central peak in density is composed of particles still bound to Palomar 5. ℓ0, b0 are located Palomar 5’s cluster’s center of mass. Two large gaps are present due to the passage of two globular clusters. Np indicates the number of particles in a bin, while N is the total number of particles, which is 100 000.
Current usage metrics show cumulative count of Article Views (full-text article views including HTML views, PDF and ePub downloads, according to the available data) and Abstracts Views on Vision4Press platform.
Data correspond to usage on the plateform after 2015. The current usage metrics is available 48-96 hours after online publication and is updated daily on week days.
Initial download of the metrics may take a while.