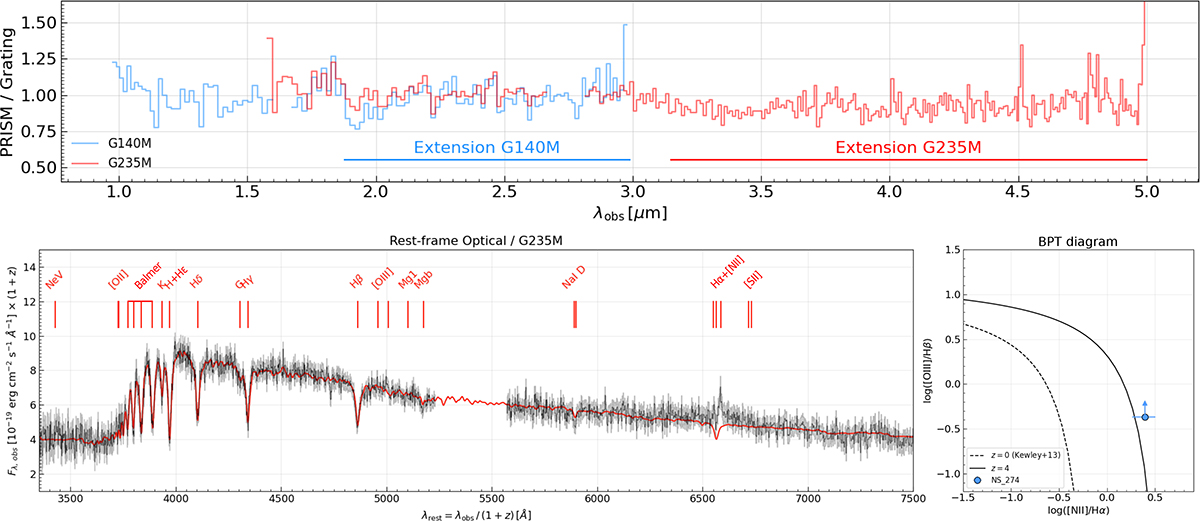
Fig. A.1.
Download original image
Top: Flux density ratio between the PRISM and the G140M (blue line) and G235M (red line) grating spectra in the custom reduction of NS_274. We mark with a solid line the extended wavelength coverage. Bottom: Extended G235M spectrum of NS_274 (black) and its uncertainties (gray). The red line indicates the best-fit pPXF model of the stellar continuum. The panel on the right shows the location of the source in the BPT diagram based on the measurements in the extended G235M spectrum. The dashed and solid black lines indicate the empirical parameterization of the line dividing star-forming galaxies and AGNs by Kewley et al. (2013) at z = 0 and z = 4, respectively.
Current usage metrics show cumulative count of Article Views (full-text article views including HTML views, PDF and ePub downloads, according to the available data) and Abstracts Views on Vision4Press platform.
Data correspond to usage on the plateform after 2015. The current usage metrics is available 48-96 hours after online publication and is updated daily on week days.
Initial download of the metrics may take a while.