Fig. 9.
Download original image
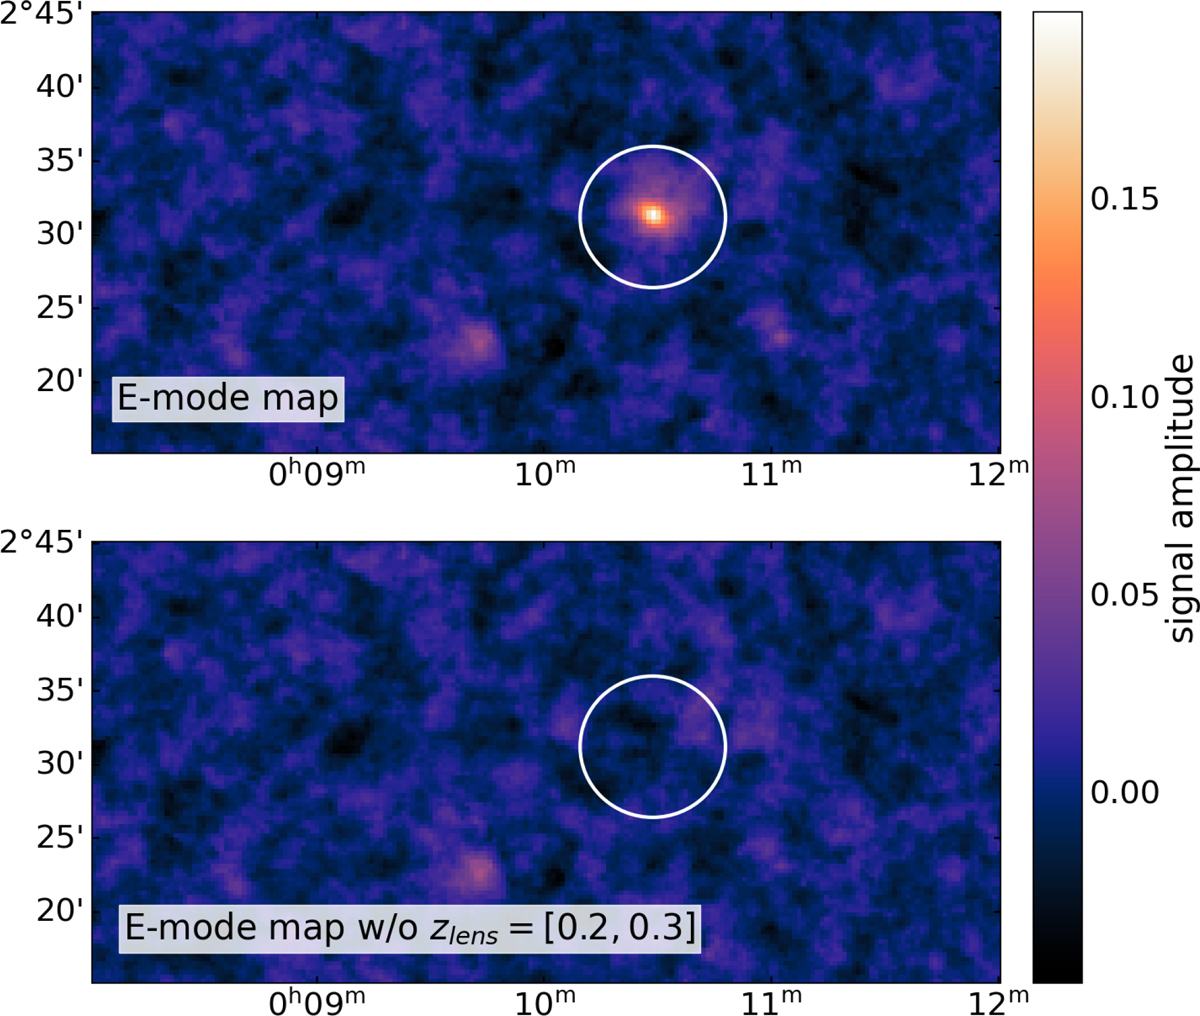
E-mode lensing signal map for a 0.5 deg2 region, extracted from the COMPLETE run. Top panel: E-mode map including all lens planes. Bottom panel: E-mode map created by excluding the zl∈[0.2,0.3] lens plane. The map was created excluding the plane which contains the cluster responsible for the highest peak, whose position is identified by the white circle in both panels.
Current usage metrics show cumulative count of Article Views (full-text article views including HTML views, PDF and ePub downloads, according to the available data) and Abstracts Views on Vision4Press platform.
Data correspond to usage on the plateform after 2015. The current usage metrics is available 48-96 hours after online publication and is updated daily on week days.
Initial download of the metrics may take a while.