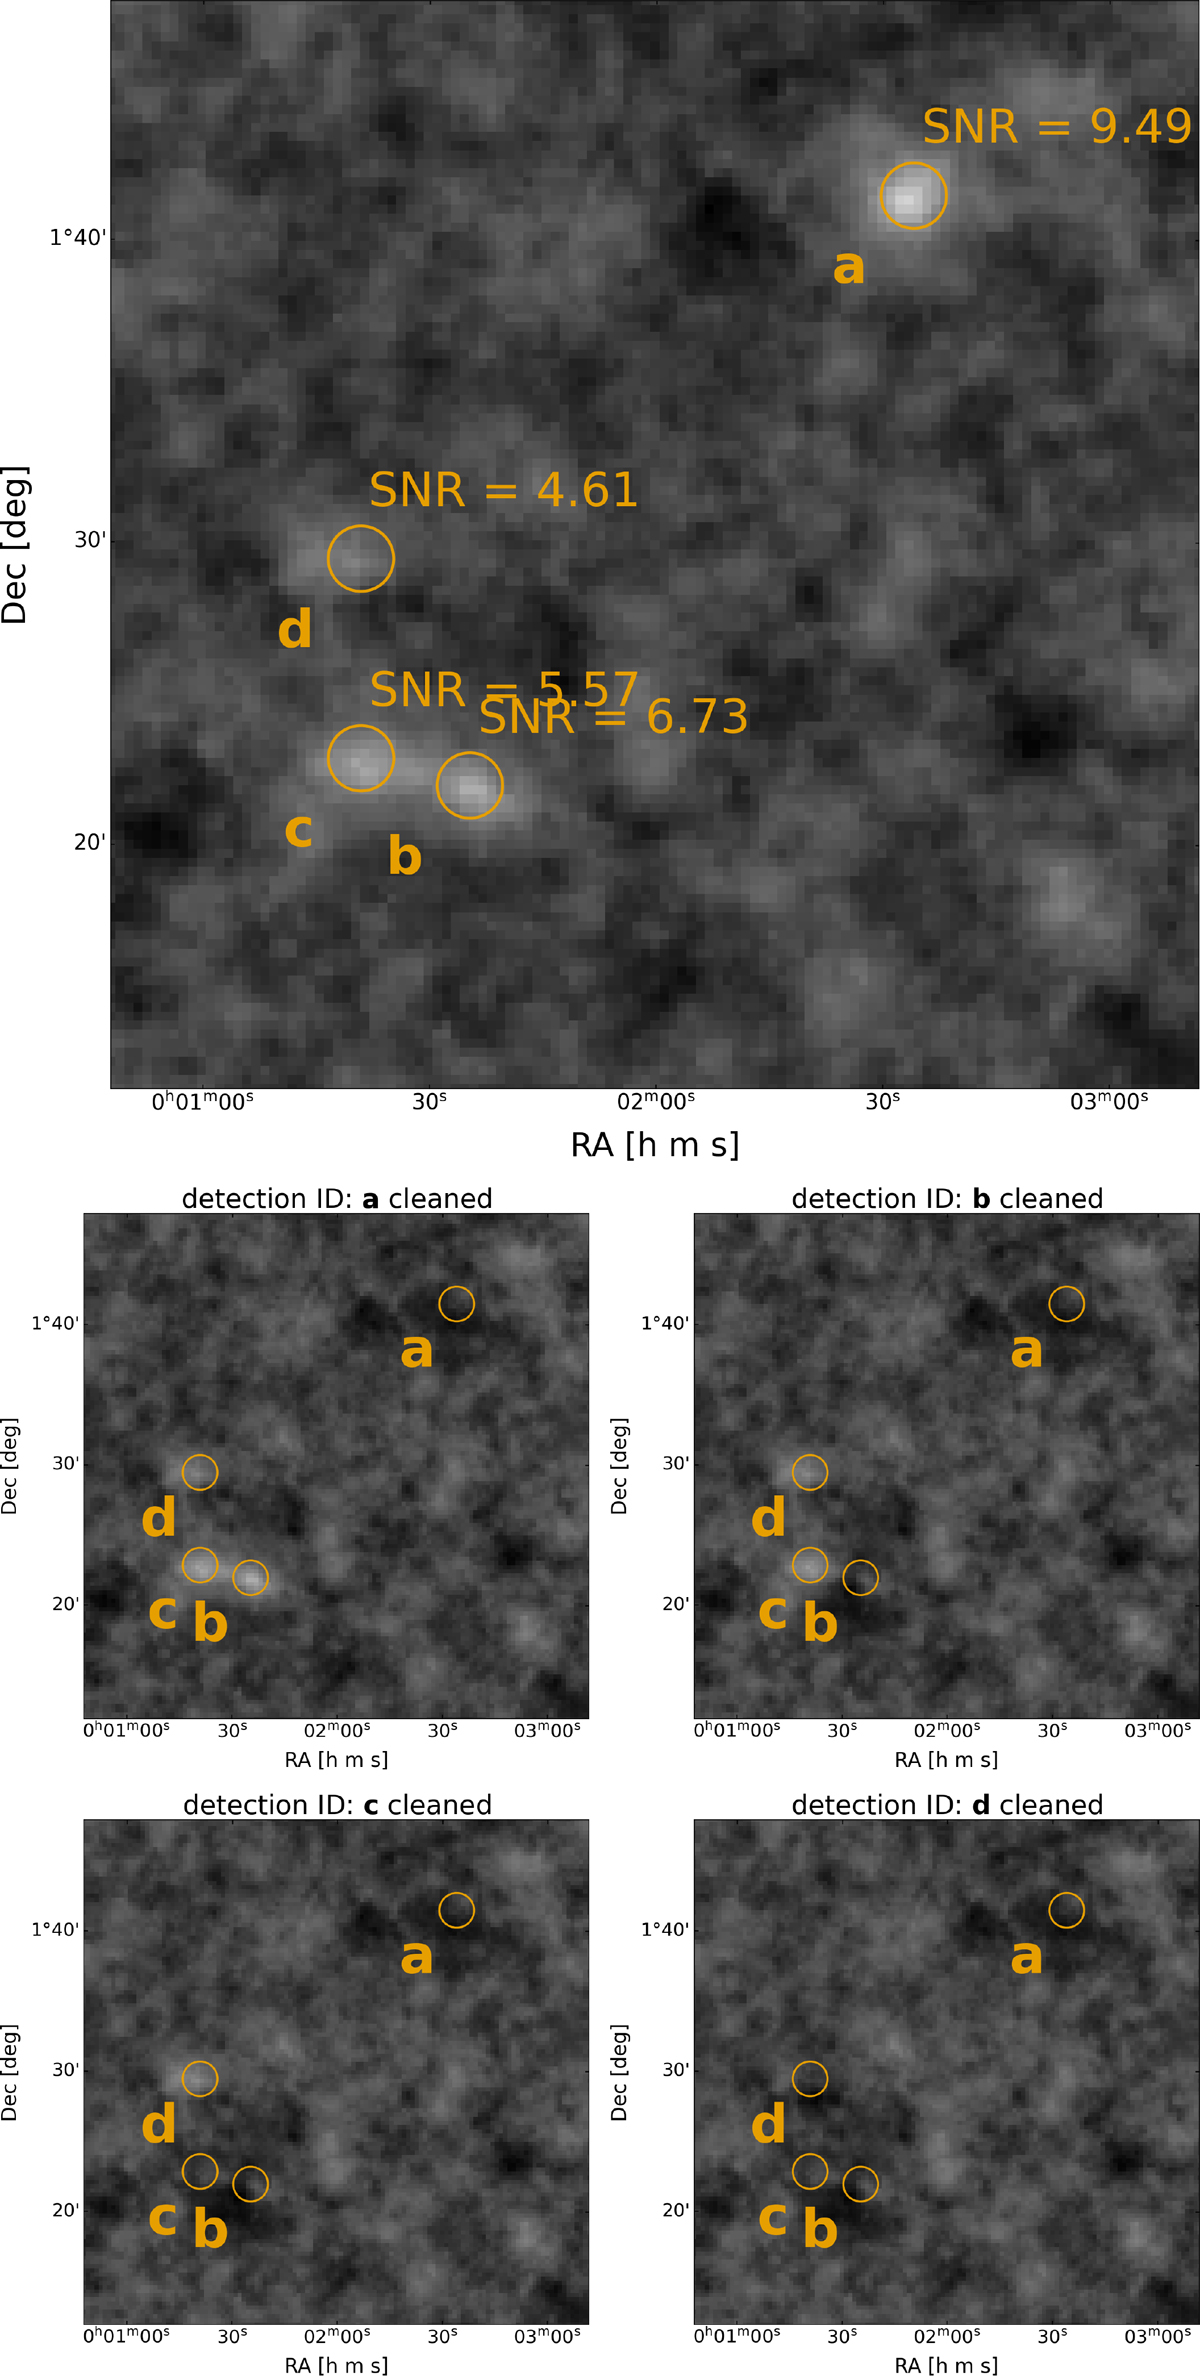
Fig. 7.
Download original image
Example of the cleaning procedure on a 0.36 deg2 region containing 4 signal peaks, indicated as a, b, c and d. Each circle is centred on the pixel with the maximum amplitude. The corresponding S/N is also reported, as ‘SNR’. Top panel: Amplitude map before cleaning. Smaller bottom panels: Amplitude map after each of the sequential cleaning steps. The algorithm detects and removes each peak in descending S/N order: first peak a (top-left), then peak b (top-right), peak c (bottom-left), and finally peak d (bottom-right), leaving at the end a map without any significant signal.
Current usage metrics show cumulative count of Article Views (full-text article views including HTML views, PDF and ePub downloads, according to the available data) and Abstracts Views on Vision4Press platform.
Data correspond to usage on the plateform after 2015. The current usage metrics is available 48-96 hours after online publication and is updated daily on week days.
Initial download of the metrics may take a while.