Open Access
Fig. 5.
Download original image
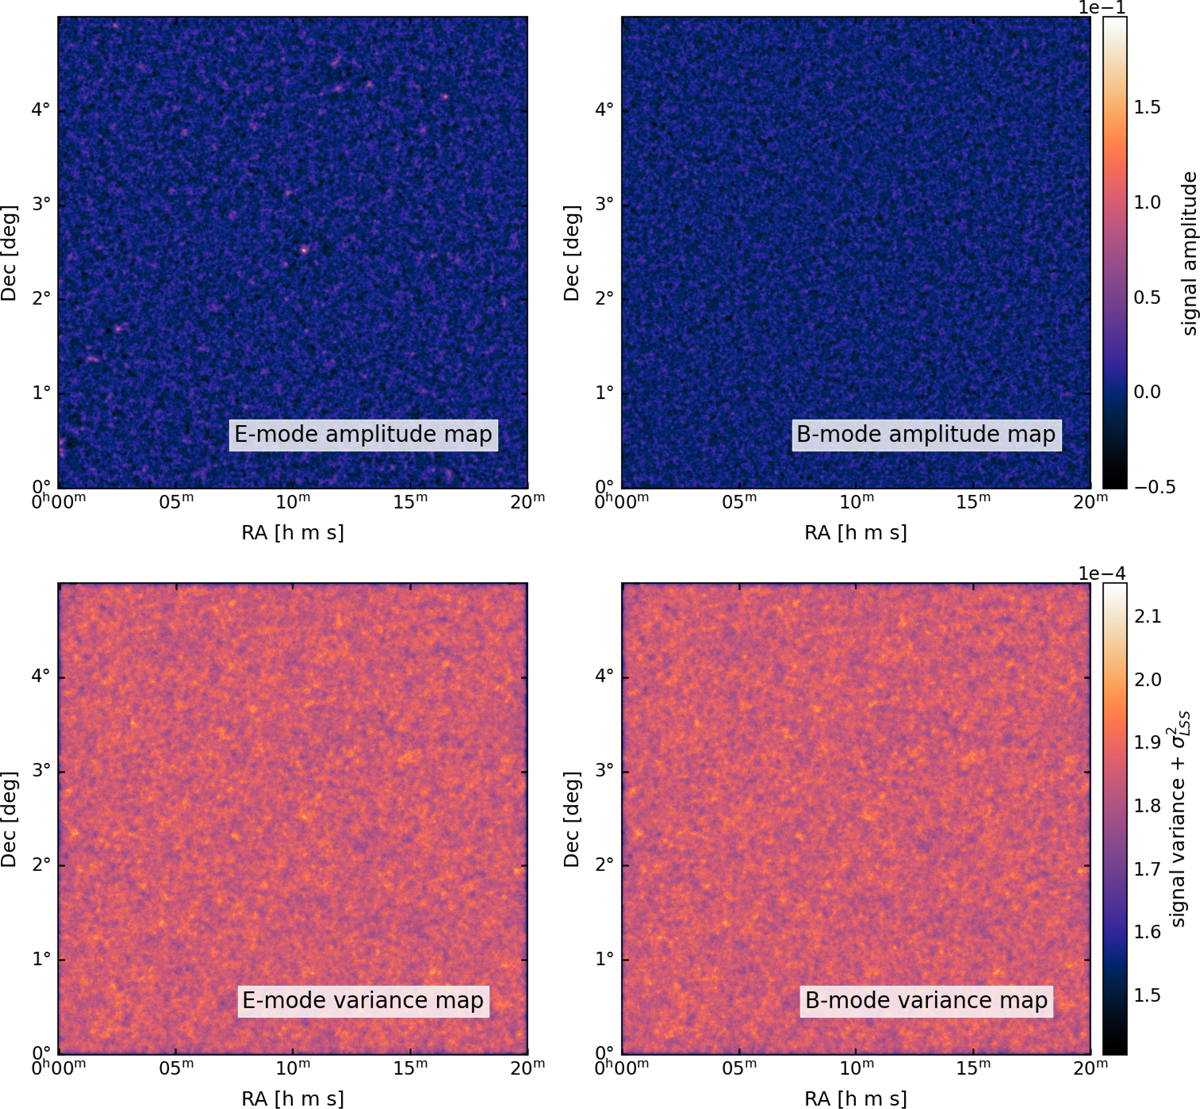
The E-mode amplitude and its variance lensing signal maps are shown in the top-left and bottom-left panels, respectively, while the B-mode amplitude and its variance lensing signal maps are shown in the top-right and bottom-right panels. The maps cover a field of view 5° × 5° and refer to the COMPLETE run.
Current usage metrics show cumulative count of Article Views (full-text article views including HTML views, PDF and ePub downloads, according to the available data) and Abstracts Views on Vision4Press platform.
Data correspond to usage on the plateform after 2015. The current usage metrics is available 48-96 hours after online publication and is updated daily on week days.
Initial download of the metrics may take a while.