Fig. 14.
Download original image
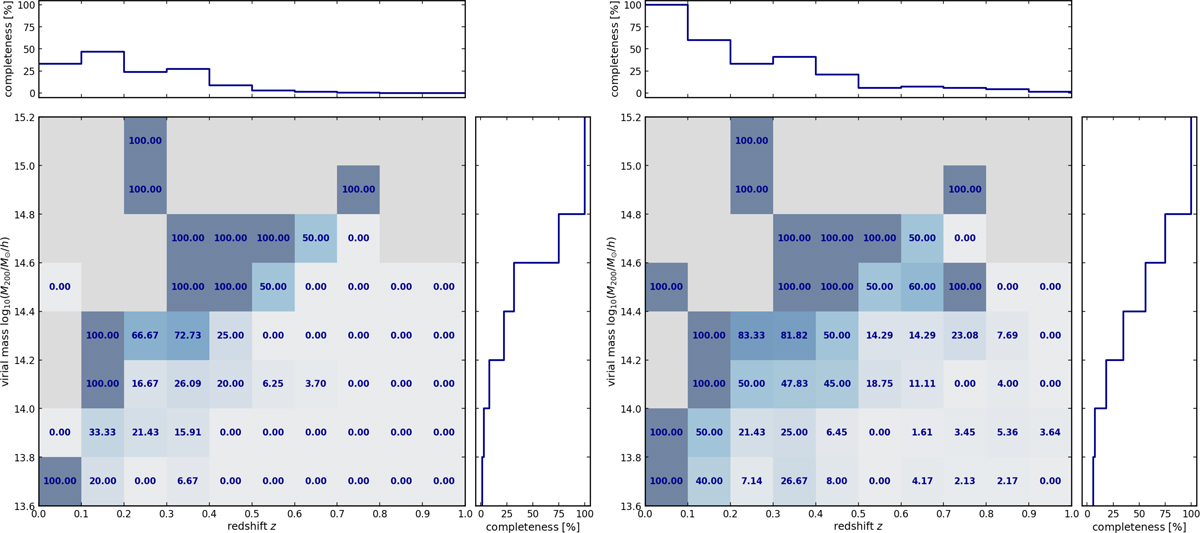
The sample completeness in two-dimensional bins of redshift and virial mass of the matched haloes for the COMPLETE (left panel) and FR02 (right panel) runs. Both samples are cut at the S/N threshold corresponding to a 70% purity. The colour map and the values reported inside the two-dimensional bins both refer to completeness. The side plots show the completeness as a function of redshift (on the top) and mass (on the right).
Current usage metrics show cumulative count of Article Views (full-text article views including HTML views, PDF and ePub downloads, according to the available data) and Abstracts Views on Vision4Press platform.
Data correspond to usage on the plateform after 2015. The current usage metrics is available 48-96 hours after online publication and is updated daily on week days.
Initial download of the metrics may take a while.